The Big Short Squeeze
Summary
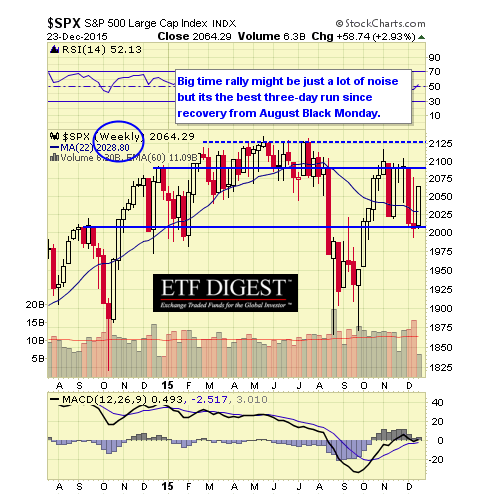
- The Santa rally wasn't destined to be faded or shorted as the S&P 500 is now nearly flat on the year.
- There's just next week to take us home to win or lose the year for portfolio manager bonuses.
- But, that said, you never know when the forces of darkness will cause a reappearance.

The Santa rally wasn't destined to be faded or shorted as the S&P 500 is now nearly flat on the year.
There's just next week to take us home to win or lose the year for portfolio manager bonuses.
As you may or may not know, bonuses can be calculated in a variety of ways. For instance, how a manager performs relative to a benchmark like the S&P, the Dow or any combination of other factors too lengthy to list here.
Economic data was mixed as Durable Goods Orders were only flat at 0.0% but important Core Capital Goods Orders fell to -0.04%. Personal Income & Spending rose 0.03% overall; New Home Sales rose to 490K after adjustments for prior data fell to 470K from 495K, allowing for headline "beat" (comical?); and, Consumer Sentiment rose to 92.6 vs. prior 91.8. What got the bulls energized was a rally in crude oil as a large inventory drawdown won the day: -5.9 million bbls vs. 4.8 million bbls.
Again leading the way higher was the beaten down energy sector sporting good gains. Nevertheless, the sector is just off support we've highlighted the past year.
Barring other news, we'll be taking a holiday, so in the absence of our snarky comments, play nice!
Market sectors moving higher included: Most sectors.
Market sectors moving lower included: Volatility (VIX), Treasury Bonds (NYSEARCA:TLT) and not much else.
The top ETF daily market movers by percentage change in volume whether rising or falling is available daily.
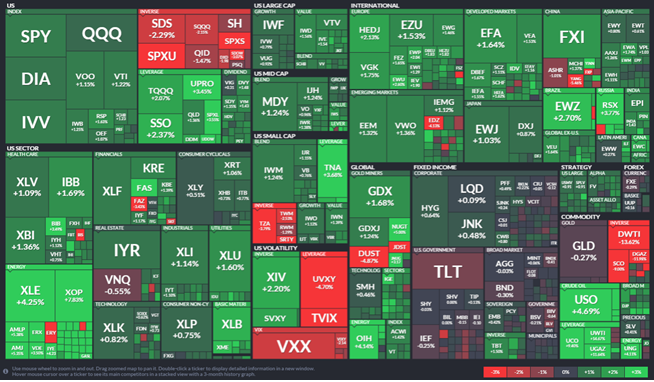
Source: Finviz
Volume was higher and breadth per the WSJ was positive.
Sign up to become a premium member of the ETF Digest and receive more of our detailed charts with actionable alerts.
You can follow our pithy comments on twitter and like us on Facebook
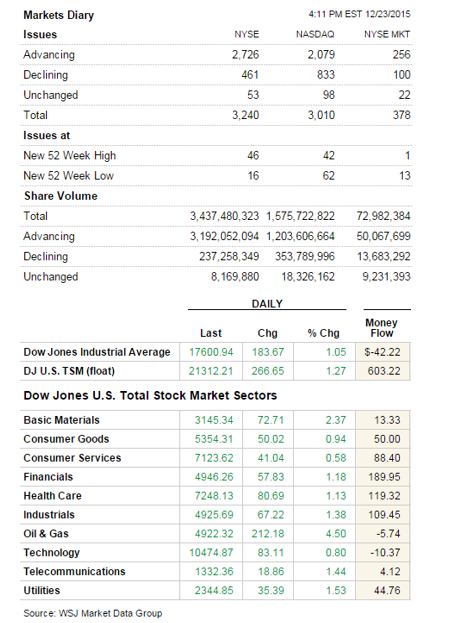
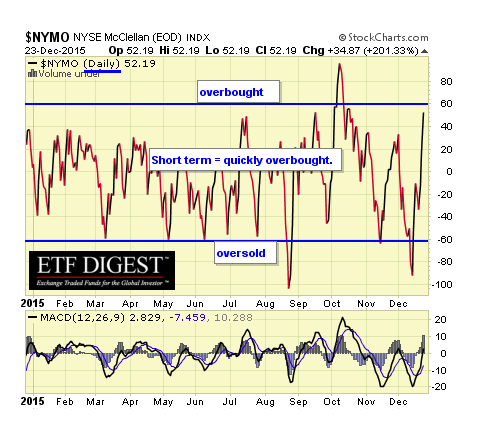
CHART OF THE DAY

NYMO DAILY
.
The NYMO is a market breadth indicator that is based on the difference between the number of advancing and declining issues on the NYSE. When readings are +60/-60 markets are extended short term.
NYSI DAILY
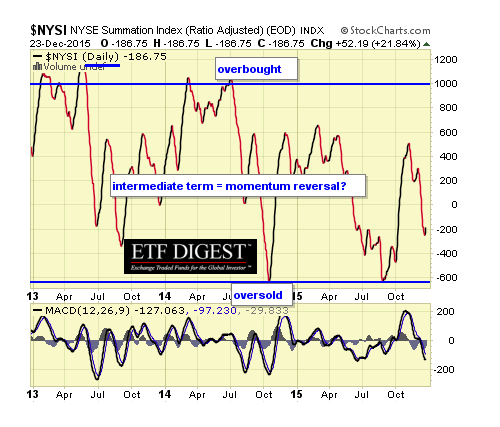
The McClellan Summation Index is a long-term version of the McClellan Oscillator. It is a market breadth indicator, and interpretation is similar to that of the McClellan Oscillator, except that it is more suited to major trends. I believe readings of +1,000/-1,000 reveal markets as much extended.
VIX WEEKLY
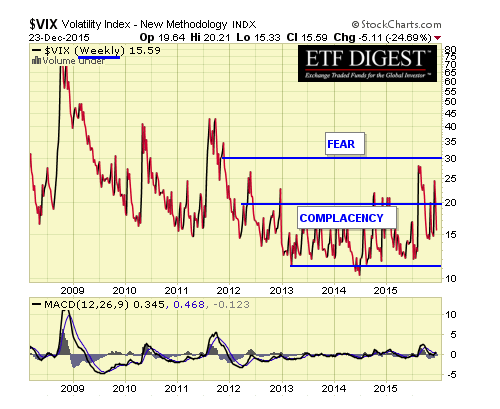
The VIX is a widely used measure of market risk and is often referred to as the "investor fear gauge".
Our own interpretation has changed due to a variety of new factors including HFTs, new VIX linked ETPs and a multitude of new products to leverage trading and change or obscure prior VIX relevance.
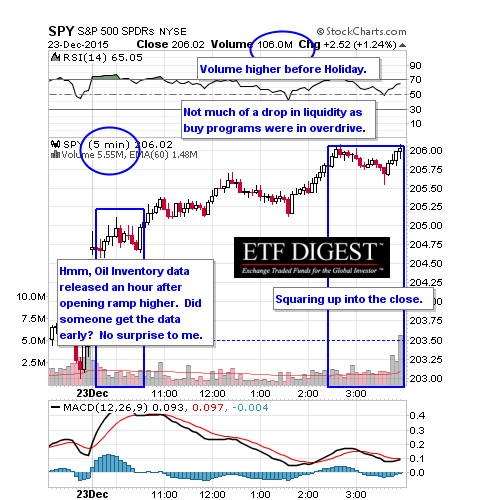
SPY 5 MINUTE
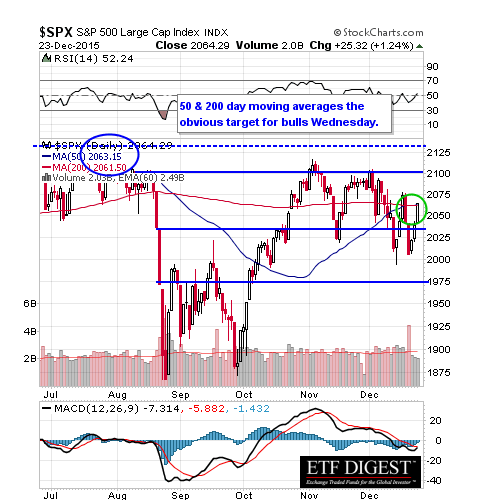
SPX DAILY
SPX WEEKLY
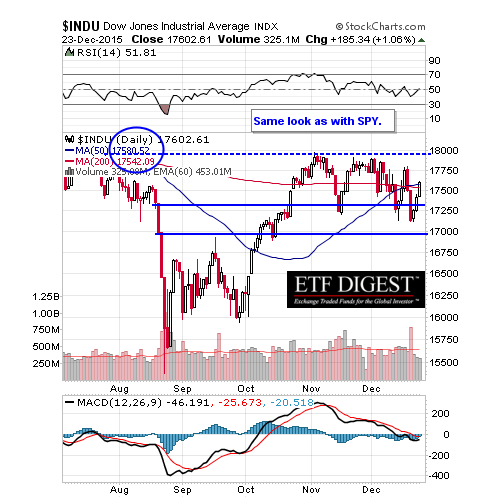
INDU DAILY
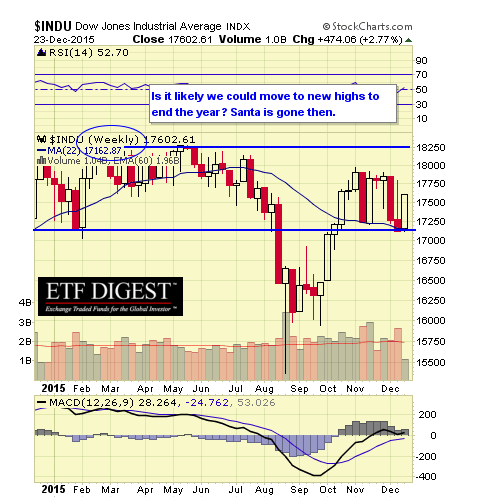
INDU WEEKLY
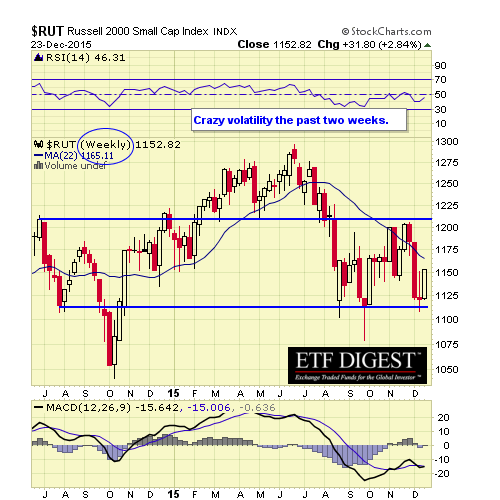
RUT WEEKLY
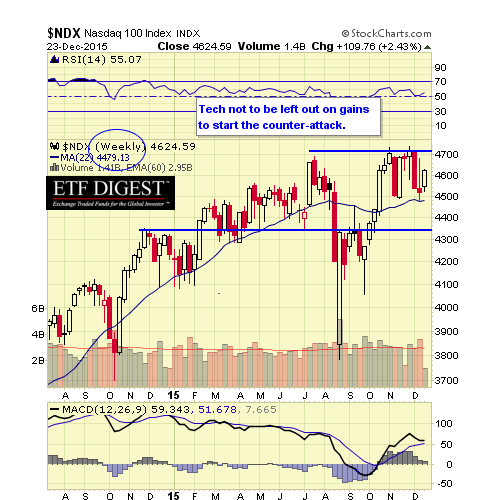
NDX WEEKLY
Closing Comments
As I indicated Monday, there's more economic data due on Wednesday, including Durable Goods Orders; Personal Income & Spending; New Home Sales and Consumer Sentiment.
That should then end my posting for the week and enjoy family and friends. But, that said, you never know when the forces of darkness will cause a reappearance.
Let's see what happens.
0 comments:
Publicar un comentario