Summary
Inflation and unemployment statistics have improved.
There is variety in how GDP per person has changed.
Stock markets show similar behavior, especially during crisis periods. Thank you goes to large and homogeneous institutional investors from developed countries.
I have kept the text in its original form, even the notes for references are there, so readers who are truly interested can go and find that source material here. This information is only one-year old, so it is still quite accurate and hopefully interesting reading for everyone. I have added new comments to update the situation if seen necessary.
Productivity
In the graph below, it can be seen how annual unemployment percentage and annual inflation percentage have changed from 2000 to 2013. Datastream provided the unemployment rates, annual inflation was by the World Bank, but for Chile (year 2000), Trading Economics had to be used. They are presented together, because as unemployment decreases, it can be expected to result in larger wages, and as spending increases, also inflation rises. Especially inflation numbers are interesting, because if companies and individuals cannot trust prices, then they will have less reason, less motivation to invest or do anything that would even improve their own future. Therefore, controlled inflation is important for any economy to grow on a sustainable basis.
(click to enlarge)
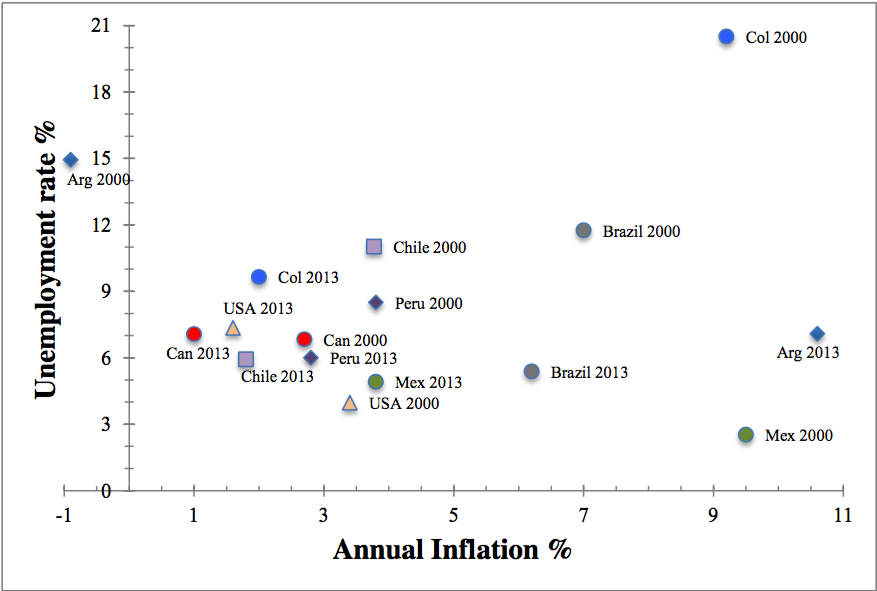
Figure 5. Inflation and unemployment, 2000 and 2013 compared
Update: Notable difference to the situation one year ago is that, while USA and Canada continue with a very low inflation with Mexico (going lower), other Latin American countries have higher inflation rates compared to one year.
It can be quickly seen that 2013 values for all countries except for Argentina are very close together.
Countries have moved considerably closer together towards low inflation and also, low unemployment percentages. Clear change can be seen when comparing values from 2000 to 2013.
Negative effect of this positive situation is that low unemployment is expected to lead to growing wages and higher inflation if neither the population nor the immigration manages to provide enough workers for the growing industries.
This again might lead to unemployment and lower inflation as outsourced jobs move to cheaper areas (and jobs that can be outsourced from their home country in question). I would not expect this to happen quickly as emerging markets are generally far from the price level of developed economies, but for long-term planning, it must be remembered what special skill sets certain areas possess so that rising prices would not make companies close their local offices, such as mining companies closing mines when miners' wages are above revenues from the ore they are hired to mine.
With Argentina, it must be noted that some sources, at least some individual economists, expect its inflation to be well over thirty percent in 2014 (BBC 2014b). It is also stated that government of Argentina has been manipulating inflation statistics for years (The Economist 2014d).
Castellano, Aracena and Smearman published a report in January 2014 concerning Argentina, where they state that, since 2010 inflation has been over twenty percent, it was more than twenty five percent in 2013 and is forecasted to be over thirty percent in 2014 and 2015 (Castellano, Aracena and Smearman 2014: 1).
Update: Inflation in Argentina continues high, but is reporting finally becoming more truthful? News: 40% inflation?; Example how prices have changed; Inflation reporting becoming truthful?
Now, let's move on to productivity and compare how low unemployment is related to it. Low unemployment can lead to rising wages as competition for employees is tougher. Rising wages then lead to lower productivity (plus, to missed growth, as there are not enough workers available). Also, low unemployment doesn't guarantee that workers are effectively employed. To look into this, Table 1. below shows annual GDP numbers per person employed based on the numbers by the World Bank.
What can first be seen is that top three countries with lowest unemployment (Canada, USA and Chile) are also top three countries in terms of productivity per person employed in 2012. If we look at Colombia and Peru, we see that from 2000 till 2012 productivity in Peru has grown 45.4%, and in Colombia, 21.7%. Of course, these two started from a very low GDP. Brazil on the other hand has had only very minor growth, but having large population means a lot in this case.
Update: Latest unemployment statistics show that most countries are quite close to each other, between 6 and 8 percent of the population being unemployed (according to tradingeconomics.com).
Interesting details are that in Brazil unemployment has jumped from being close to 4% to close to 8%, and Mexico has the lowest unemployment. Luckily, Mexico has a large young population that is entering the workforce.
Table 1. GDP per person employed
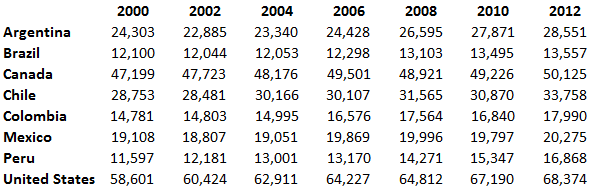
What can also be seen, somewhat surprisingly, is that in Argentina, productivity has grown a similar amount as other countries. Canada with Mexico had the slowest growth, percentage wise. With Canada, this is understandable, as developed countries can find it more difficult to grow fast, but when compared to USA, Canada is far behind. Mexico's slow growth is surprising. Perhaps this is because developed countries merely use Mexico as a cheap labour provider, and this doesn't improve the status of Mexico's population, since free trade among non-equal countries is a perpetual exchange of technological products and commodities/natural resources/cheap labour. Therefore, there is no real development of Mexico due to its trade with the developed countries, as there is no stimulus.
Of course, it must be remembered that Mexico, due to its large population, has the fourth largest GDP among these eight countries, and thanks to its large young population, it also has plenty of future workforce that is still being educated. More people will equal more output, even if GDP per person stays the same. Of course, best results are achieved by having growing population and also rapid improvements in productivity. Those countries that are not as fortunate as Mexico to have a growing population with plenty of young, their mission is to increase workers' productivity. Simple means for this are improved infrastructure and healthcare.
Credit Rating
To give an idea of credit ratings of these countries, I am using a model created by Trading Economics. It takes into account the average credit rating given to the country by different rating agencies. It also takes note of multiple economic indicators such as exchange rates, government bond yields and commodity prices. Averaging these ratings guarantees that one credit rating agency is not able to have a great influence and manipulation to the final number.
Maximum number a country can get is 100, and the higher the number, the better the country's credit credibility is.
Ratings from largest to smallest: Canada 98.06; USA 96.86; Chile 76.83; Mexico 55.85; Peru 53.24; Brazil 50.73; Colombia 49.65; and Argentina 25 (Trading Economics, Rating). There are no real surprises to be seen. The most developed countries, USA and Canada, are at the top, Argentina is at the bottom, and other five Latin American countries are in the middle being quite close to each other. Based on the evidence already presented, I believe Chile could be rated better than it currently is, due to its long stability and the strong growth it has presented. Peru can be expected to be the next country that manages to separate itself from the group if its growth continues, and therefore, it manages to gain more trust from the international community. Brazil and Argentina might be experiencing lower ratings in the future due to Brazil's small GDP growth rate and Argentina's default situation.
Update: No surprise there. Brazil's rating today is 41 and Argentina's rating is 20. Other countries are close to previous numbers or a bit better.
Foreign Exchange Reserves
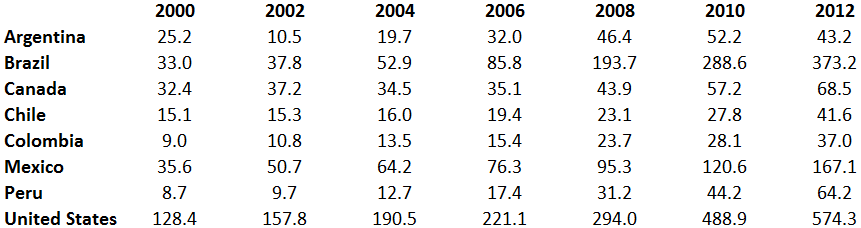
Foreign exchange reserves are monetary reserves that are gained by international trade and held by the central bank of a country. It can use them to affect the value of its currency if it so decides. Table below shows the amount of reserves per country per every even year, as was reported by the World Bank. What stands out is Argentina's weak growth and current negative development concerning its reserves. Also, it can be noted that the USA, Brazil and Mexico have grown their reserves at a much faster pace than rest of the countries while Canada's reserves are on the same level as Peru's.
The message behind this table is relatively important. Even though some countries can present better annual GDP growth percentages or lower government debt figures, foreign exchange reserves hint what countries are the powerhouses of international trade among these eight countries. Top three are clear since USA, Brazil and Mexico are far ahead. Canada's low number, especially since it is close to other emerging markets, is surprising compared to what would be expected. This reminds us that even though Canada is geographically a large country, its population is one tenth of that of the USA, and it does not possess similar economic power.
Table 2. Total reserves in billions of USD
(click to enlarge)
Stock Market Development and Correlation
Here, I look at the development of stock markets to understand how these markets have changed during this time period. With emerging markets, it is especially interesting. We also see if these markets behave in a similar fashion. Comparison of development of countries' stock markets is done by using quarterly index values. Values are adjusted so that all indexes start from one to make comparison of growth easier. This does not affect how the indexes have behaved later. Numbers on the left side then show how many times market index has multiplied from 2,000 till the first quarter of 2014. Colombia's data starts from third quarter of 2001 as there was no earlier index data available.
This information is presented in two graphs because large growth of few markets would make more stable markets like USA and Canada seem absolutely flat. Mexico (currently 5.7) is a good example. Out of North American countries, it has grown much more than USA and Canada have, but when compared to Colombia (14.1 currently) and Peru (13.3 at best during 2012 Q1) and to the current situation of Argentina (11.6), Mexico's growth looks small.
It can be seen that certain markets have experienced much faster growth. One likely reason for this is that emerging markets have been undervalued, and growth is strong as more international investors join. Seems that some markets have cooled down lately while some have continued upwards. Since international demand is the main fuel for these economies, it is impossible to say for sure how their future will be. Nevertheless, it will be an interesting one.
Figures, which are based on index data provided by Datastream, show that there is a clear correlation between all these markets at least during the financial crisis period. Financial crisis period 2007-2009 shows all countries' stock markets topping around the same time, then they all reach their bottom during first quarter of 2009, and from then, their direction is upwards.
Argentina, Mexico, Canada and USA are the ones to fall closest to their starting value. Peru seemingly had the largest drop, but it also recovered quickly.
Lately, almost all indices have had quite similar slowing-down phase or even negative growth. Surprising change in Argentina's index might be due to the markets believing that the country's situation is improving (Bloomberg 2013), although evidence shown here contradicts that expectation. Perhaps some investors are trying to battle inflation by investing into stocks, maybe because stocks are a commodity that can more easily adjust to inflation. Also, certain companies can perhaps be expected to be able to keep their prices well adjusted for inflation, though with such high inflation, as suspected, it can be extremely difficult.
(click to enlarge)
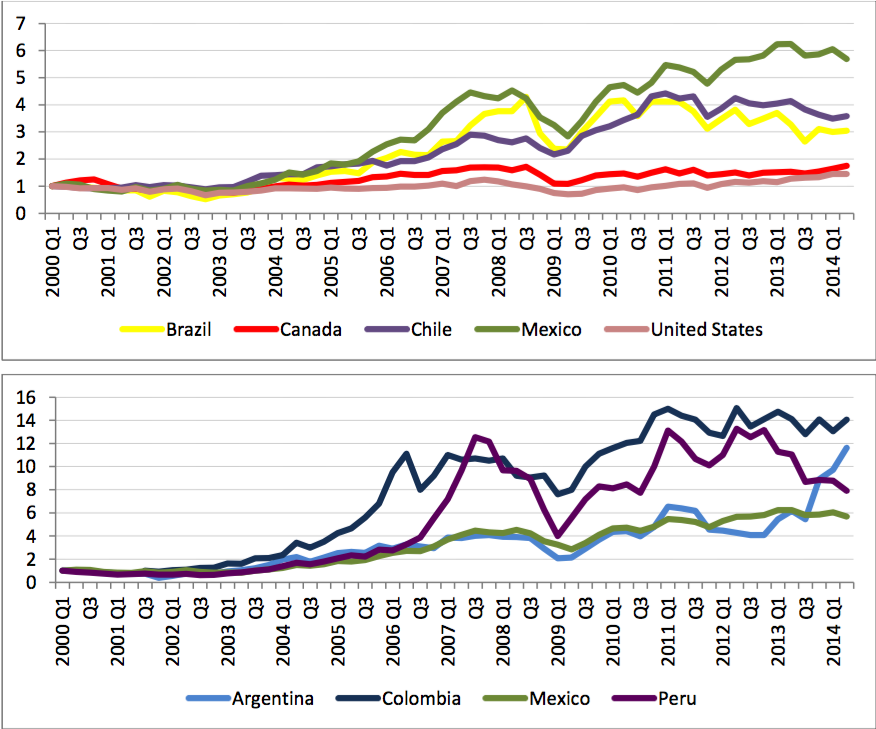
Figure 6. Stock markets
Update: One thing to note is, that because data starts from the year 2000, it is very flat for USA and Canada due to the IT bubble being strong then and later numbers are compared to that number. In recent news, all indices have lately either gone a bit down or seem flat compared to the situation a year ago. Brazil and Peru are the saddest examples, as their markets have slowly gone downwards for years.
As stated, it can be seen that all markets take a dive at the same time which tells us that there is some level of correlation between these markets. Outside that time frame, correlation seems to be weaker.
Studies by Diamandis (2009), Lahrech and Sylwester (2011), and Galvão de Barba and Ceretta (2011) all find some level of integration between the US and four Latin American nations (Argentina, Brazil, Chile and Mexico). Panayiotis states by studying 1988-2006 period that these markets are partially integrated (Panayiotis 2009: 28). Lahrech and Sylwester look into 1998-2004 time frame, but go longer in their statements by saying that co-movement has increased among these countries (except for Chile), therefore equity market instabilities in the US are more likely to be seen in those countries as well (Lahrech & Sylwester 2011: 1356).
Galvão de Barba and Ceretta look at a more recent period, 2003-2010. They find that relationship between Argentina, Brazil and the US has over time become more integrated, but Chile's and Mexico's relationship with the US did not change. Responses found are clear during the financial crisis period, but more vague during rest of the sample. They find no evidence of integration among the Latin American markets themselves. They show responses to the US stock market, but these responses are not homogeneous. Therefore, an international investor, from the point of view of international diversification, should not expect these countries to behave in the same way. For example, Chile's stock market does not seem to respond to Latin American or North American shocks. Brazil and Argentina are the ones that seem to be more vulnerable to international equity market shocks and that could be due to growth of foreign investments in their countries. (Galvão de Barba & Ceretta 2011: 142).
0 comments:
Publicar un comentario