Weekly Market Update: The Bull Market Is At Its Most Critical Juncture Since It Began
Summary
- Seasonality is now an issue, as September hasn't been kind to investors over time.
- The US equity market has disconnected from the US economy, and at the moment is trading with the Chinese economy on sheer emotion.
- Given the present technical picture, the bulls will need to 'pull a rabbit out of the hat' to avoid more downside pain.
- In my view, what ails the markets does not appear to be earnings fear driven.
"I don't want a lot of good investments, I want a few outstanding ones."
Philip A.Fisher
That is a message that many investors may want to pay special attention to now, as I believe this bull market is at a critical juncture with some difficult tests ahead.
We're now more than eight months into the year and people are already starting to talk about how certain investment styles are not working for them anymore. In the financial world, people jump to the conclusion that six or seven months is considered statistically significant because everyone assumes that the short-term trends trump all. I am not as surprised with this mentality, given the recent market action.
The proliferation of a wide variety of ETFs and mutual funds make it easier than ever for investors to allocate to just about any type of strategy or risk factor they choose. One also has to wonder just how much the ETF landscape has skewed some of the data that market analysts and investors track. Not to mention how much their mere existence impacted the 1,000 DJIA point drop on August 24th.
The problem with looking at just the latest performance figures is that there's no context involved. This type of thinking is how investors make mistakes.
Nothing makes sense when you look at just the most recent performance in the stock market or its various components, risk factors or strategies. You always have to keep an eye on what's happened in prior years or longer-term cycles to see how mean reversion and short-term momentum can come into play.
We all can fall into the trap of making quick judgments about the markets based on short-term moves or indicators. That brings "doubts" that creep in when anything we invest in is underperforming or losing money. The conclusion that follows then, is how certain investment styles or strategies, don't work anymore.
Case in point, after being the best-performing sector in 2014, Utilities have underperformed so far this year and dividend strategies have come into question. Markets are pricing in rising rates ahead of the first Fed rate hike, and these sectors have felt some of that adjustment.
Empirical Research reports that since 1952, the Utilities and Healthcare sectors outperformed the market 50% of the time in the first six months after the first rate hike. Consumer Staples and Telecom 55-60% of the time, and Energy 70% of the time. In fact, outside of Technology, the five sectors that had the best track record after initial rate hikes were ones favored by many income strategists. It may be time to give these underperformers a look, especially energy, given those statistics.
Jumping in and out of the different risk factors or a variety of strategies is a difficult game to play. I don't know of anyone who can do it consistently. If you find an asset class or strategy you're comfortable investing in over the long haul, you have to get used to the fact that they're not going to work every single year. The energy sector sure fits that description lately, doesn't it? At the end of the day, it is sometimes better to sit back, observe, and do nothing, rather than chase your tail.
One strategy that I truly believe cannot be ignored or abandoned is Dividend Growth Investing.
In my opinion, it is a must for all investors, no matter age, station in life, etc. Now with a caution flag raised for the entire market, this strategy should be drawing investors' attention.
History reveals that since 1928, the S&P 500 has gained 7.53% a year and has been positive 66% of the time. If you include dividends, the results improve to 11.53% a year and up 72% of the time. That is a serious improvement as it infers that when an investor includes dividends, the annual return increases by 53%.
With the power of compounding interest, the results are striking when you take that extra few percent over a period of time.
A $100 investment in 1990 without including any dividends, grows to $582. When dividends are added and compounded, that $100 grows to $972. That is 67% more for doing nothing, but assembling a portion or all of your portfolio using dividend growth stocks.
(click to enlarge)
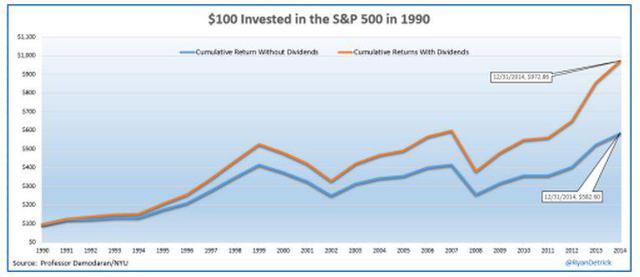
Source Professor Damodaran - NYU
Don't lose sight of the fact that if we do in fact see more market weakness amidst a volatile backdrop, the income stream from this strategy will bolster your bottom line.
Unless you are a rabid bear, no one is going to be sorry to see August come to a close. For anyone long equities, it was pretty much the worst and most volatile month you have seen in a long time.
Good riddance to August, welcome to September. So, should we be relieved? That depends.
September has historically been the worst month of the year for the Dow. Over the last ten years, the S&P 500 has actually been up in the month of September seven times. What gives the month a bad reputation, however, is that when the S&P 500 does decline, the losses are steep.
August ended with a loss of over 6% for the month and as we enter September, I was wondering how this month plays out when August finishes poorly. The news for the bulls is not too good, as Septembers following down Augusts have been even worse than the "average" September.
I should note that the "average" September is the only month of the year where the Dow has averaged declines over the last 100, 50 and 20 years.
I can add that investors that want to look past this fact can take solace that the market has tended to bounce back when looking at the final four months of the year, which includes the down Septembers.
More on the ramifications of what this month may bring to the equity market later.
ECONOMY
Ed Yardeni discusses an issue which I have repeatedly stated in my missives. The issue of creating a "headline" to "scare" investors.
The U.S. economic scare of the week is all of the talk about how the recent GDI (Gross Domestic Income) number is not tracking with the recent GDP number that was just revised upward. Thus suggesting that a recession is looming.
(click to enlarge)
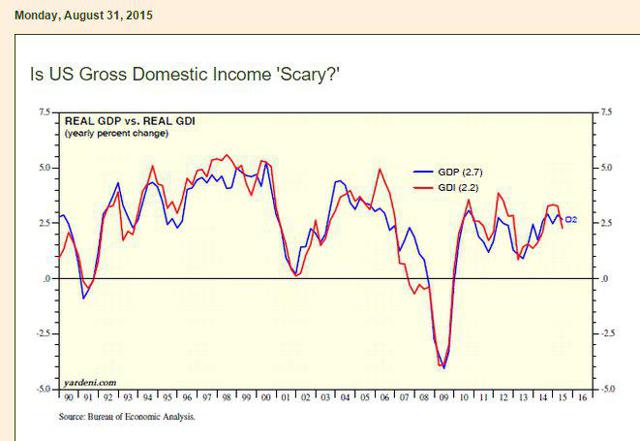
As Mr. Yardeni points out, the comparisons need to be investigated before one jumps to a conclusion, and after reading his missive, there is nothing "scary" about the divergence at all.
While all eyes are focused on China, the data here in the U.S. continues to show some positives.
No surprises with the latest Chicago PMI report as it came in as expected. While the Dallas Fed report disappointed, here is a review by the folks from Bespoke Investment Group.
U.S. Auto Sales remain at a strong level, as Fiat Chrysler (NYSE:FCAU), Ford (NYSE:F) and GM (NYSE:GM) post better-than-expected August sales. F should be on your shopping list if you are looking for a stock with a 4.3% yield that is fundamentally sound.
"In the Tuesday release from Ford, the company announced total sales of 71,330 F-series trucks in the month of August. That represents the strongest month of truck sales since 2006."The August non-manufacturing ISM report came in at 51.1, lower than economist predictions. However it is still showing expansion.
"Economic activity in the manufacturing sector expanded in August for the 32nd consecutive month, and the overall economy grew for the 75th consecutive month, say the nation's supply executives in the latest Manufacturing ISM® Report On Business®."US Construction Spending Reaches Highest Level in 7 Years
"The Commerce Department said Tuesday that construction spending rose 0.7 percent to a seasonally adjusted annual rate of $1.08 trillion, the highest level since May 2008. The report also revised up the June increase in construction spending to 0.7 percent from 0.1 percent previously."The Institute of Supply Management's (ISM) non-manufacturing/service sector index for August released this past Thursday showed the activity slightly slowed but continues to hover near decade highs. The index printed at 59.00, bettering the estimate of 58.2, but lower than the previous month's figure of 60.3. The sub indices highlight a slight slowdown in employment, but still promising.
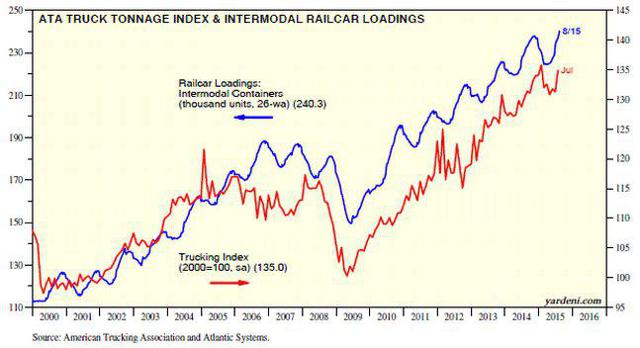
If you need another indicator to restore your confidence in the U.S. economy, take a look at the ATA trucking index. It rebounded smartly during July and is almost back to its record high during January of this year. Intermodal railcar loadings rose to a record high in mid-August.
(click to enlarge)
In my view the August Jobs report continues to show strength in the employment picture. With the prior two months adjusted upward, job growth in the past 3 months has averaged 220,000.
The unemployment rate is now at 5.1%.
Friday's market action suggested that investors are now like "deer in the headlights", as they envision a 0.25% rate increase in September. The negative market reaction to this report can only be described as irrational.
Bottom line, the US economy has plenty of bright spots, and many of the recent reports are not tracking to the recent market action.
GLOBAL ECONOMY
China kept the global markets on edge after they reported their PMI report on Tuesday, with this headline "China Factory Gauge Slips to Three-Year Low in August "
"Chinese manufacturers saw the quickest deterioration in operating conditions for over six years in August, according to latest business survey data. Total new orders and new export business both declined at sharper rates than in July, and contributed to the most marked contraction of output since November 2011."Of course, no one seemed to read the next sentence, "Weakness could be temporary, but it's clear economic engines not running at full speed."
Neither did they read this headline which came out the same morning
"German manufacturing PMI hits 16-month high."
"Germany Manufacturing Purchasing Managers' Index rose to 53.3 in August from July's 51.8. The actual figure surpassed the estimate of 53.2.Nobody was impressed with this report either, also released later that day:
"Euro-Area Joblessness Declines to Lowest Level Since Early 2012."
"Unemployment in the euro area unexpectedly declined to its lowest level in more than 3 years, signaling the region's recovery is gaining pace even as dark clouds from China draw on the horizon."Investors are obsessed with "everything" China.
EARNINGS
Of the 495 companies that have reported earnings to date for Q2 2015,
- 74% have reported earnings above the mean estimate
- 51% have reported sales above the mean estimate.
- The 12-month forward P/E ratio is 15.2. This P/E ratio is based on Friday's closing price (1940.51) and forward 12-month EPS estimate ($127.76).
- The comps for the Energy sector and the US dollar start to get easier as we move into year-end 2015.
- Ex-Energy, the blended revenue growth rate for the S&P 500 would jump to 1.5% from -3.4%.
SENTIMENT
It seems like a broken record, but "bulls" are now at the lowest levels since the March 2009 lows.
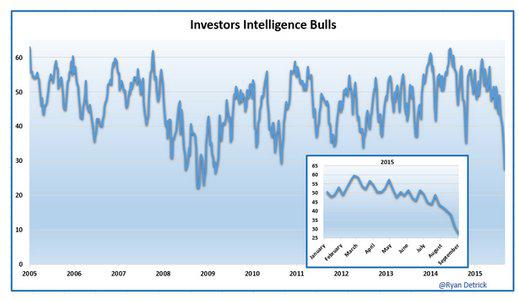
Source: Seeitmarket.com- courtesy of Ryan Detrick
The market surely stopped going down in March 2009, might the same logic apply here?
CRUDE OIL
A huge intraday turnaround in WTI during this past Monday capped a three day rally of 25%.
That price action helped solidify my thoughts that what I was witnessing was simply not a throwback rally from the lows of $37 bbl. Apparently the oil market had come to grips that global demand wasn't going to fall off a cliff.
Unfortunately, that scenario seemed to be tossed out of the window. The very next day, the entire global demand picture was reversed as WTI gave back 7% in the single session. However the critical $42-$43 level that I highlighted last week has held.
By one measure, the volatility in crude oil over the last two weeks is at levels that exceed what we saw when prices first crashed late last year and have not been seen since the Financial Crisis.
Here are some thoughts to ponder in order to maintain a rational perspective of the situation.
Everyone knows that WTI is down from the 3 digit highs and that is ALL anyone is talking about. Fact is, crude oil is trading right about where it has traded in the last 100 years.
I can't speak for what others who view the following chart will say, but I am hard pressed to find where global demand is subsiding.
(click to enlarge)
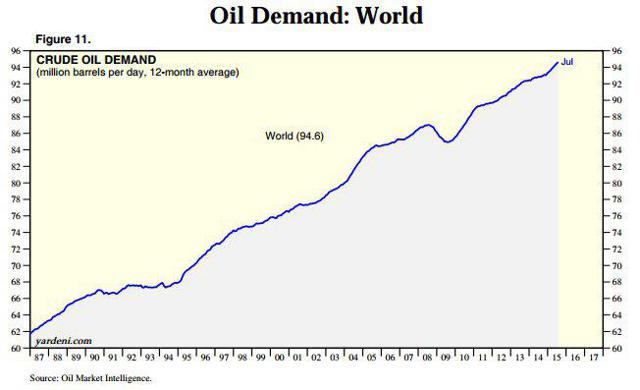
Sooner or later, the supply side of this equation will come in balance as well. So unless you have a very short time frame for your energy positions, those facts need to be given some serious thought.
Investors tend to extrapolate all news and in some cases 'fact' as negative. Especially when they are experiencing losses. Studies have shown that losses are processed in the same part of the brain that responds to mortal danger. If that is true, then market participants have experienced their share of mortal danger with their energy sector positions.
If we stop to take a look, we need to realize that the crude oil market is trading about where it "averages". An investor now has to decide, given their personal risk tolerance, if they feel the tables are now slanted to a positive risk/reward scenario. If one has a time horizon of 18 to 24 months or longer, I believe that it is now slanted to the reward side of the ledger.
That suggests the beaten down names like (NYSE:CVX), (NYSE:OXY), (NYSE:COP), (NYSE:XOM) and the like should work well for long-term oriented investors. The operative words being "long term".
For additional ideas, here is the link to the Energy names I thought would be good candidates for research in July.
THE TECHNICAL PICTURE
One market factor investors must deal with today is the increased influence of algorithmic trading and indexing. As a result, in order for programs to trade the market, these programs must evaluate certain technical market patterns and trading these patterns can be a self-fulfilling prophecy.
No doubt they contributed to some of the wild rides the market has been on recently. The difficulty for fundamental investors is that fundamentally strong companies will not perform, and will be tossed aside in the short run if the "technicals" are not bullish. This is where opportunities are presented.
All eyes were on the "Death Cross" that was recorded on the DJ 30. Many chart watchers believe a death cross, when the 50-day MA crosses below the 200-day MA, indicates that a shorter-term decline has developed into a longer-term downtrend. Now it is time for everyone to focus on the same situation that has taken place with the S&P 500 and the Russell 2000.
So what are the implications for the S&P 500 going forward? This event has only happened 10 times in the index's history.
History reveals that while performance over the next week has been positive more than it has been negative, the S&P has run into trouble in the month following the Death Cross. The index's average one-month return has been a negative 1.38% with positive returns just 20% of the time.
That's extremely negative, and it suggests that investors should be prepared for more volatility in the near term. Over the next three and six months, however, the index has been up significantly, and much more than the average return for all three and six-month periods throughout history. Over the next six months following these crosses, the S&P has been up nine of ten times for an average change of +8.23%
Declines are certainly not without precedent, but 90% of the time the market has managed to shake it off and bounce back nicely. There are likely to be more sharp moves lower in the near term, so be prepared for them.
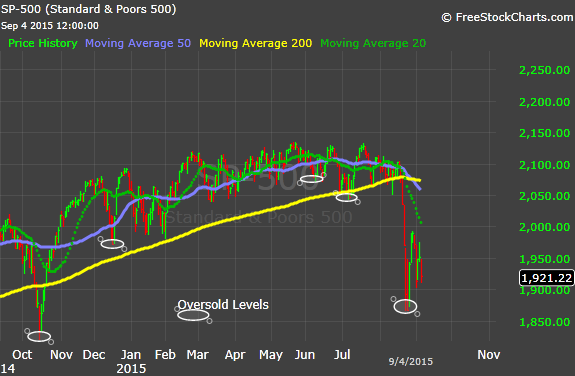
Moving averages are lagging indicators by the nature of their construction. In other words, the patterns traced out in the moving averages follow the price of an index or stock. When the death cross is triggered then, it is likely most of the price decline in the index or stock has already occurred.
Again, the exception is around recessionary economic periods. In my view, the US economy continues its slow growth pace and does not dip into recession.
This week's choppy action confirmed the entire rally from last week's S&P 1867 low was "corrective", as was the rally from Tuesday's 1903 low. Being classified as "corrective" rallies implies that the downtrend is still underway.
If I had to take a stab at support for this downtrend, it appears to be in the low to mid 1800's on the S&P. Before then, 1901 and 1867 can come into the picture.
SHORT-TERM OUTLOOK
There is one thing and one thing only that should be paramount on investors' minds as the market enters a very weak seasonal period. Will the August lows that were just posted hold?
In an attempt to remain objective, I presented my findings last week on two key technical issues that, in my view, cannot be ignored. Very simply, a significant breach of these lows will make it difficult if not impossible for the market to reverse the "caution" flags I outlined last week. The Dow Theory Sell signal, and the warning flash on the 20 Month MA for the S&P.
The worst scenario for the bulls is that a retest brings about new significant lows below 1867.
That would force the issue and I will begin to acknowledge the Dow Theory "sell signal" of August 24, 2015. For the moment I am setting that sell signal aside, just as I did when the May 2010 "Flash Crash" Dow Theory sell signal (the last time the Dow fell 1000 points intraday), was flashed.
Moreover, market participants should be aware that retests usually come close to, or actually make a marginally lower low, than the capitulation low.
For the record, the lows that are on my radar are S&P 1867, Dow 30 15871 and the Dow Transports, 7466.
Along with the Dow sell signal, another technical indicator flashed red when the S&P fell below the 20 Month MA. That data point was detailed in last week's update.
Both of the signals I mention "can" be reversed. At the time of this writing, the S&P can reverse the 20 month MA violation by retaking the average which now sits at 1998. In addition, that MA is still in an uptrend and that is a positive.
Here is the strategy I have employed recently. Use the advice contained in Mr. Fischer's quote.
Look to concentrate positions staying with the "Outstanding Ones". Serial underperformers, if not already sold, should be eliminated. But as I have mentioned many times, it's always best to have a plan that tends to save you from yourself in volatile markets.
This next stage will likely be difficult to navigate. On a short time frame, with an elevated VIX regularly, trends broken, and manic intraday volatility, there's no reason to pile in at these levels, except on high-conviction, long-term holdings.
I don't diminish the headlines and MORE IMPORTANTLY the market reactions to those headlines. However, the head scratcher to all of this is that the economic data here in the US does not indicate a bear market coming and other data points seem to confirm that.
"The US equity market has disconnected from the US economy and at the moment is trading with the Chinese economy, on sheer emotion." - From Bespoke Investment Group.
Here is evidence as to what I am referring to.
"The refusal of stocks to rally on excellent data that was recently reported, is striking. Despite the huge auto sales figure reported, Ford (F, -1.08%), GM (-2.72%), Fiat-Chrysler (ADR FCAU, -3.40%), Toyota (TM, -3.41%), AutoZone (AZO, -0.23%), etc. all got hit despite their direct exposure to the market. If this isn't good evidence that the current slide in U.S. stocks has a life of its own completely divorced from the US consumer economy, I don't know what is."
INDIVIDUAL STOCKS
The only stocks that I have on my radar screen are what I would call my long term "High Conviction" list:
AAPL, GILD, CELG, DIS, OXY
SUMMARY AND CONCLUSION
While worries that a slowing China may pull down the rest of the world is on the minds of investors, the key variable going forward will be the US economy's ability to support global growth and earnings. In that vein, it's difficult to see how a slowdown in Chinese growth would have any significant impact on the ongoing US expansion given that exports to China make up less than 1% of US GDP.
We have entered a new phase of the current economic expansion and bull market. After three years of explosive asset price gains, with a very real pause in 2011, stocks are breaking trend lines for the first time in years. You can assign whatever narrative you want to it. China, cross-asset stress brought about by oil, concern over global growth or the Fed. There are pieces of truth in all of those, but the reality is "fear" and "irrationality" are in focus as investors are now shunning equities.
Focusing on one data point, one headline, is a great way to allow yourself to get wrapped up into accumulating a junk heap of unwarranted conclusions.
The newly formed "Death Cross", combined with weak seasonal backdrop, suggests that September could be very interesting. These issues, added to an already weak technical picture, add more fuel to the bearish fire that has started. The bulls will need to pull a rabbit out the hat to avoid the negatives that seemed to have stacked up against them.
If the equity market can muddle through September without more technical damage there may be a silver lining waiting for market participants as "history" then dictates that the October through December time frame may in fact be very positive. Therein lies the "best case" scenario for the bulls.
Of course, if the market's internal strength deteriorates further on the second wave down, it could be indicative of something more serious. But right now, I haven't seen any sign of that, so panic would be premature.
US bear markets have been caused by sharp contractions in liquidity that sparked a severe economic slowdown or recession and by technical factors such as too much optimism in two instances, 1962 and 1987.
Neither of these bear-market preconditions is present now. US economic data is improving and the individual retail investor was pulling money out of the market before the recent market turmoil. Since 1987, there has never been a bear market without a recession.
Yet the technical picture being presented may be forecasting just that. A real conundrum for investors to ponder. Anyone not remaining vigilant now may be asking for trouble.
0 comments:
Publicar un comentario