Jul. 27, 2015 8:25 AM ET

Summary
- Gold hit my first major target - the 50% retracement of the 1999-2011 bull market.
- Although we exceeded the $1086 price level, we immediately reversed and moved higher, and may now have a tradeable low in place.
- The short term target is $1115-1130 before the decline resumes, but a move above $1140 would be a warning to the bears and may indicate a bigger rally ahead.
The rest of the week was spent consolidating, which is a fairly typical reaction to a large sudden price movement. We slowly drifted downwards and retested the low (exceeding it by a couple of dollars) on Friday, and as the US COMEX closed with the price exactly on that 50% Fibonacci retracement level, we then saw a decent spike higher and finished at $1099 for the week.
I have said for a while that I did not expect the $1086 level to be smashed through on the first attempt. I have long suspected that we would see buyers show up at that price, since for whatever reason traders and investors seem to like targeting round number retracements. The question now is what kind of bounce can we expect to see, and how high can it take us?
Hedge Fund Short Positions Outnumber Long Positions for the First Time
The big news this week is that the hedge funds have a net short position for the first time since the data was compiled and regularly published. Much has been made of this statistic, however the overall speculative position (which includes hedge funds) remains net long - the latest figures are below:
| COMMERCIAL | LARGE SPEC | SMALL SPEC | |||
| LONG | SHORT | LONG | SHORT | LONG | SHORT |
| 189,676 | 211,260 | 187,720 | 159,441 | 35,421 | 42,116 |
| NET CHANGE | NET CHANGE | NET CHANGE | NET CHANGE | NET CHANGE | NET CHANGE |
| +5,731 | -21,154 | -3,294 | +16,251 | -774 | +6,566 |
I find a chart to be easier to read than looking at a row of numbers, so I have included the latest CoT report in visual format also. This chart (courtesy of OANDA) shows the net position of the non commercial trader category:
(click to enlarge)
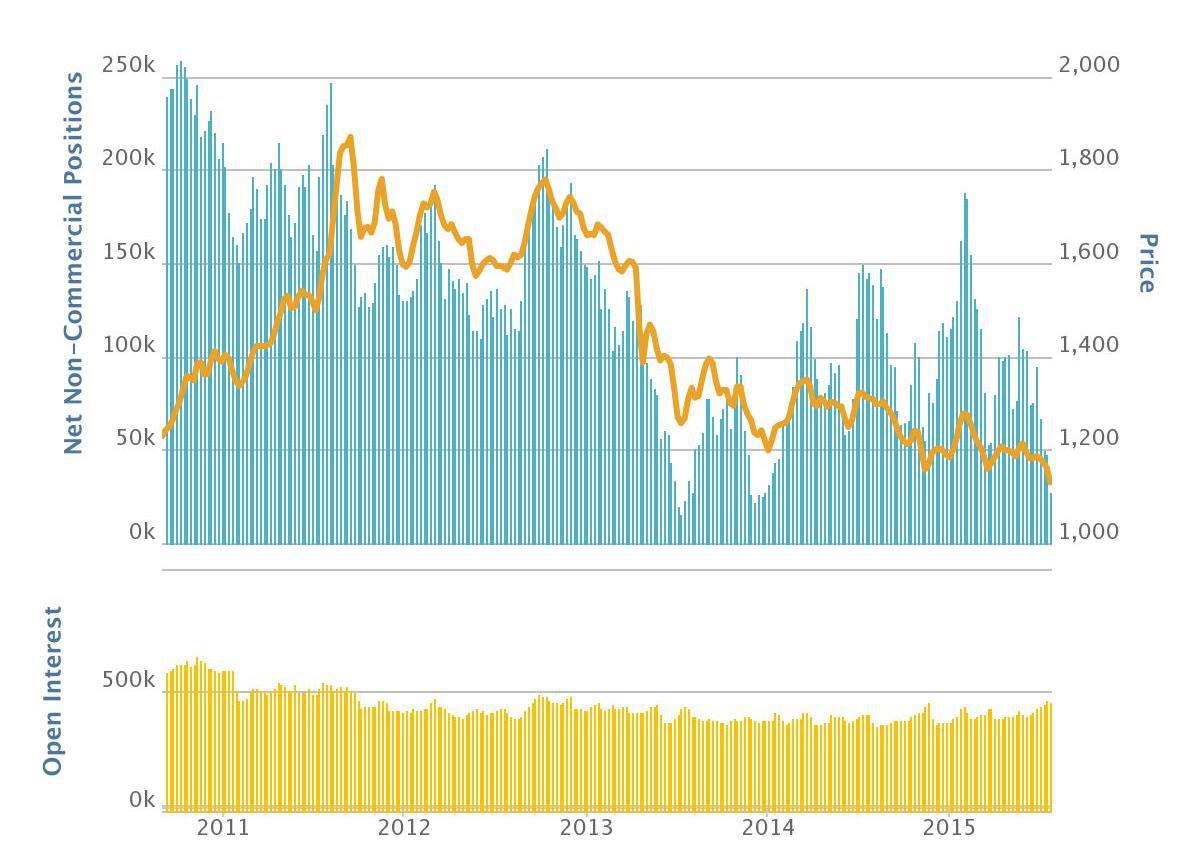
One thing to note is that the overall net long position of the speculators is not at its lowest ever reading - speculators were more bearish at the summer 2013 low - but looking at the chart we can see that previous similar net positions have led to short term rallies in the gold price, and this particular position may well indeed result in the same outcome.
The next chart is more interesting in that it shows the net position of the Commercial Trader category, and as you may expect it reflects a mirror image of the speculators' positioning. Or does it? (chart courtesy of SentimenTrader)
(click to enlarge)
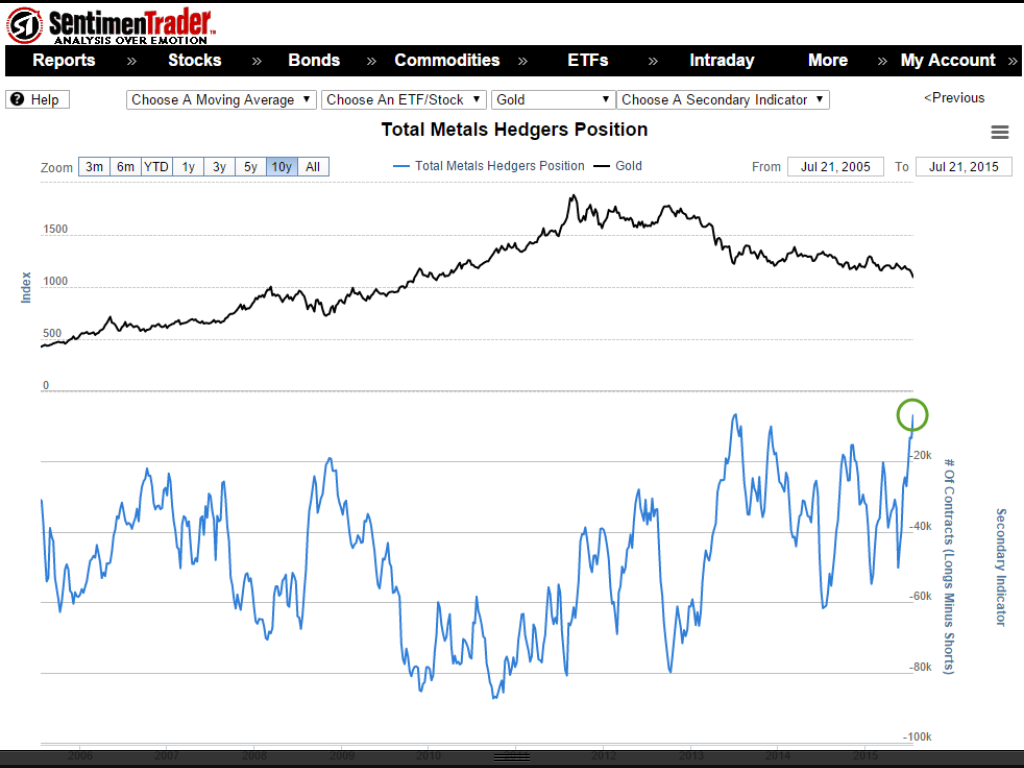
Actually it doesn't. What it shows is that the Commercial traders hold the smallest net short position in the last ten years (a new record vs. the specs' near miss), and to my mind is representative of changing sentiment towards gold - are the commercials (the guys reputedly in the know) seeing an end to the bear market in the not too distant future?
In my article a couple of weeks back I stated that to get the bear market low and trend change we will need to see the majority of the speculators become bearish on gold. They have been bullish throughout the 4 year decline as evidenced by their net positioning always being skewed to the long side. To mark a long term reversal we should see them build a massive net short position to fuel it, with the Commercials taking the other side of that trade, and I am wondering if this is exactly what we are starting to see right now.
While this week's numbers may result in an oversold bounce in gold, they are not yet at the kind of extreme we will need to see when the low is formed. To get to that position we are more than likely going to see lower prices, so if you are buying this low and expecting a big rally, please use stops and/or have an exit strategy in place just in case.
Are Mining Cost Cuts Bullish For Price?
When oil dropped in price many gold mining bulls cheered loudly, figuring that mining shares would be deemed more attractive if their cost to produce was lowered, despite the gold price continuing to decline. In theory this makes sense, but of course it also means that many more miners were able to stay afloat, and supply has therefore remained at relatively high levels despite the falling price.
This week I came across an interesting chart (published by Wood Mackenzie, Morgan Stanley) illustrating the gold industry's cost curve:
(click to enlarge)
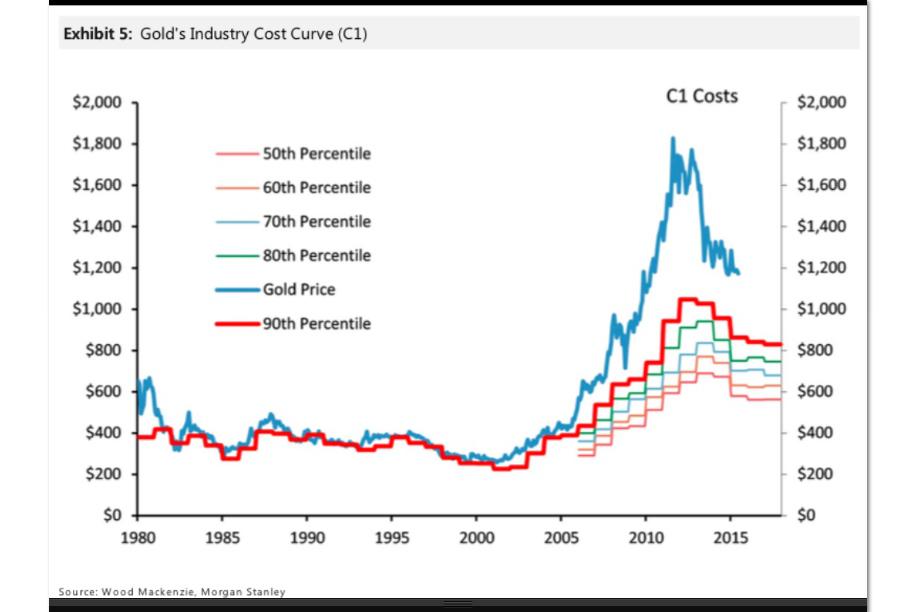
The chart shows us that over the long term price tends to remain broadly in line with or just above the cost to produce the asset being sold. However, during a boom phase the price is bid higher in quick fashion and rises well above the cost to produce - we saw this at the 1980 and 2011 highs - before peaking and returning to cost price, most likely when supply overtakes demand due to the number of new producers coming on line in an attempt to capitalize on the profit potential.
The chart shows that the cost curve sits at just above $800, and if history is our guide to the future, may foretell where price will head to next. Certainly if we are to achieve a low we should be looking for the supply side economics to change, since the falling price indicates that current supply levels are exceeding demand for gold. Thomson Reuters GFMS recent published figures (the full article can be read here) as follows:
"..in 2011 there was an overall deficit of 154.1 tonnes in the gold market, which fell to a deficit of 77.9 tonnes in 2012, then rose to a surplus of 248.7 tonnes in 2013 and 358.1 tonnes last year. While not entirely to blame for the rising surplus in the market, mine supply has been on an upward trend, from 2,845.9 tonnes in 2011 to 3,129.4 tonnes last year.. Mine supply is now projected to start declining, to 3,124.7 tonnes this year, 3,057 tonnes in 2016 and 2,970.3 in 2017. This largely reflects the closure of higher-cost operations and the scaling back of exploration expenditure in response to low prices, which curtails new projects."If you invest on fundamentals alone, these are the kind of projections you want to see to become bullish. If their forecast is correct we may see sentiment change towards gold over the next year or two, and with a further drop towards that industry cost curve, the price decline should weed out the weaker players within the mining industry and tip the scales back towards a situation whereby demand outpaces supply.
Gold Chart
If you have been following along in the comments section you will know that we were looking for a move higher towards the end of the week, and we appeared to start that move on Friday at the COMEX close.
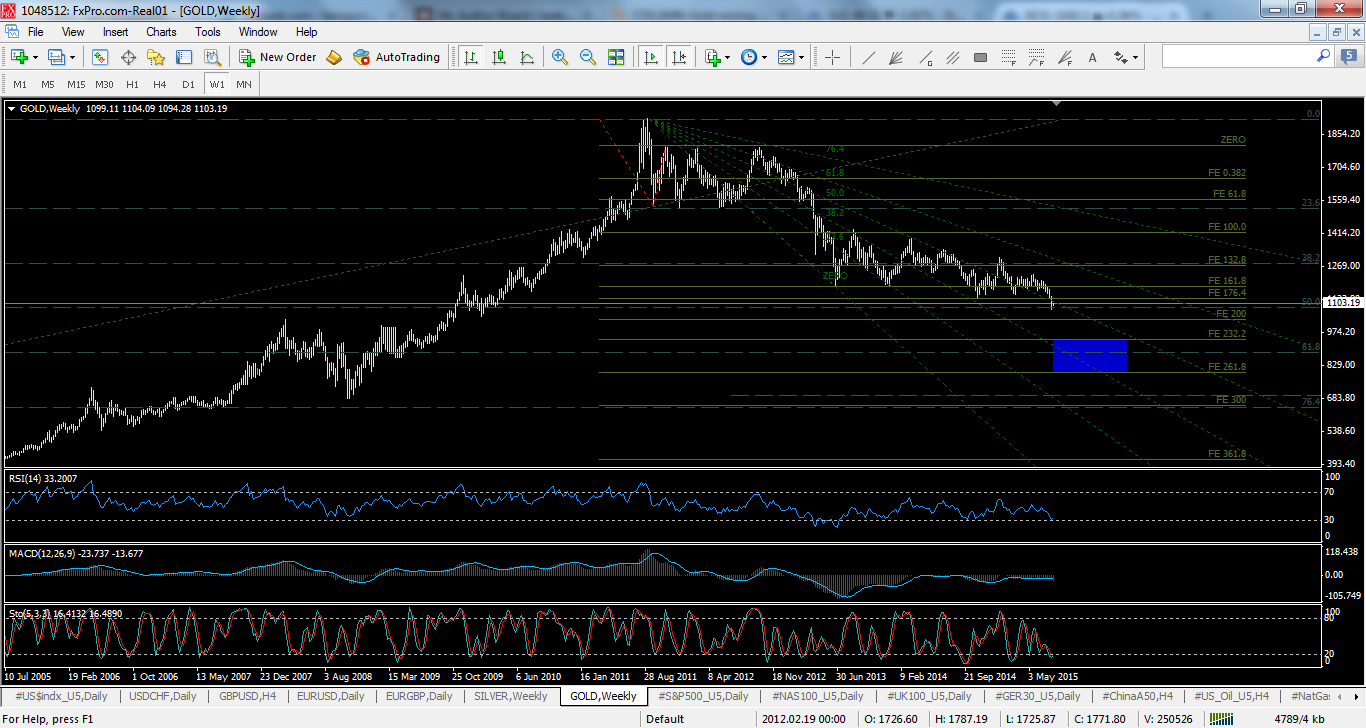
Updating the weekly chart first, we can see that we are making good progress towards my longer term target of $885 for the bear market low:
(click to enlarge)
Zooming into the hourly chart, the chances are good that we now head up to at least $1115 and most probably $1130 in the near term.
(click to enlarge)
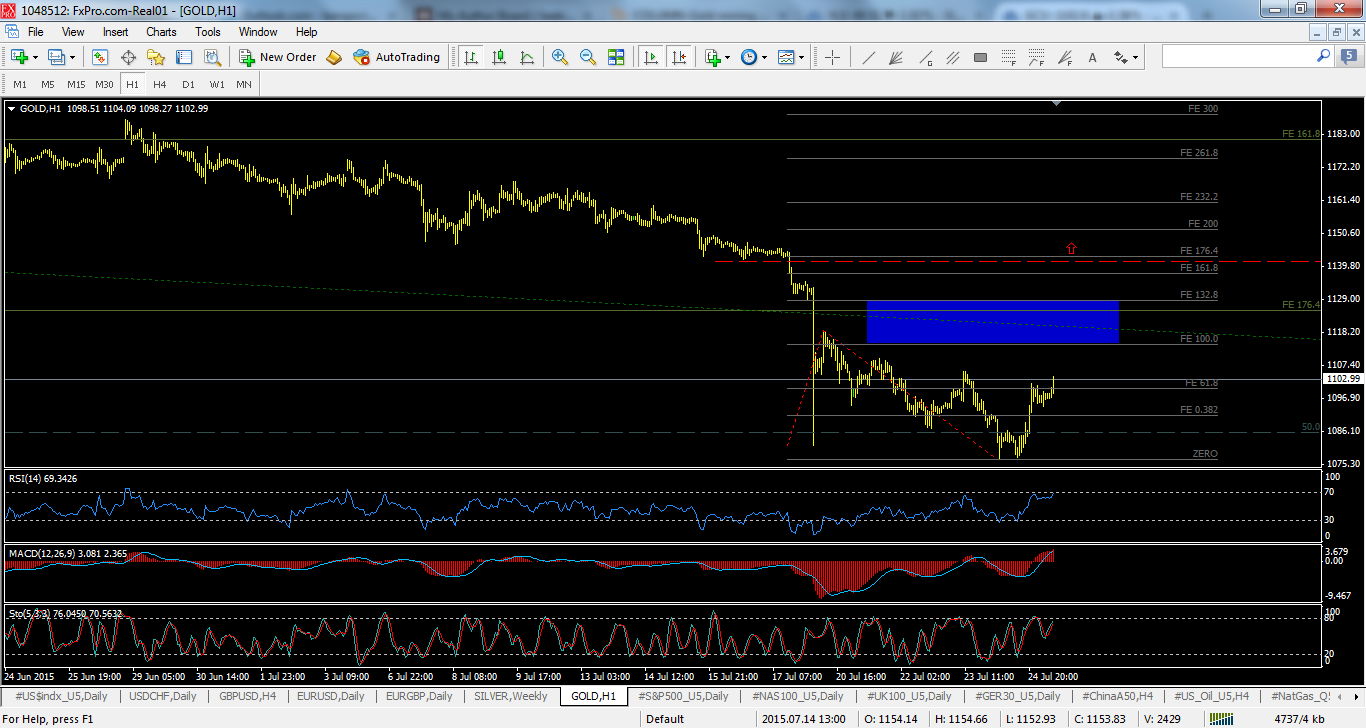
My primary expectation is that we make a top in that region and resume the decline to lower lows, but should we manage to break above $1140 the count may need to be revised.
That is now my bull/bear line - a move above and long positions/hedges should remain in place for the time being; a top and decline from that level or below, which then proceeds to take out last week's $1077 low and long positions should be exited.
As usual I will update thoughts in the comments section, and I wish everyone good luck for the coming week!
0 comments:
Publicar un comentario