A Messy End To July
Aug. 1, 2015 5:53 AM ET
Summary
- It was a positive month for most indexes thanks to some window dressing to close the month.
- Nevertheless, it was a nerve-racking month for investors overall but the bottom line for now is the long 2015 trading range for major U.S. indexes continues.
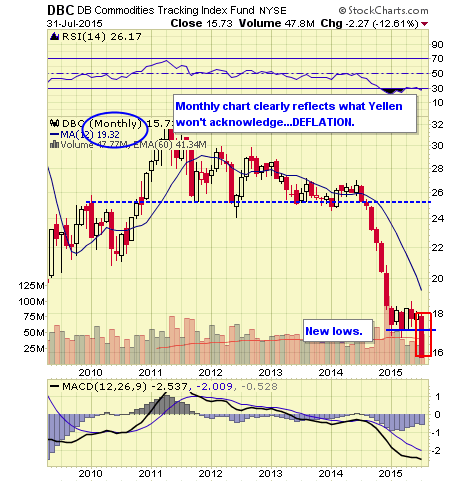
- Commodity markets continue to telegraph deflation which the Fed doesn’t acknowledge.

It was a positive month for most indexes thanks to some window dressing to close the month. To do so is illegal of course but those doing so are rarely, if ever, caught.
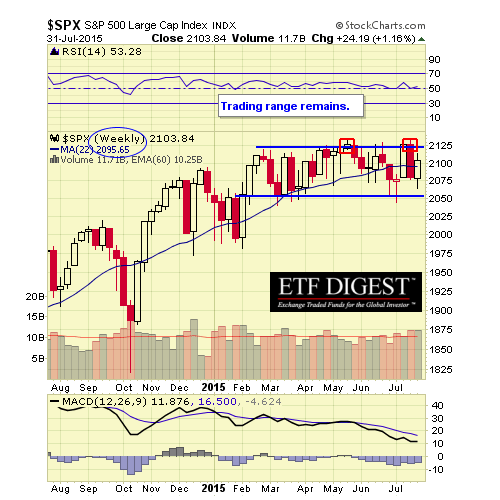
Nevertheless, it was a nerve racking month for investors overall but the bottom line for now is the long 2015 trading range for major U.S. indexes continues.
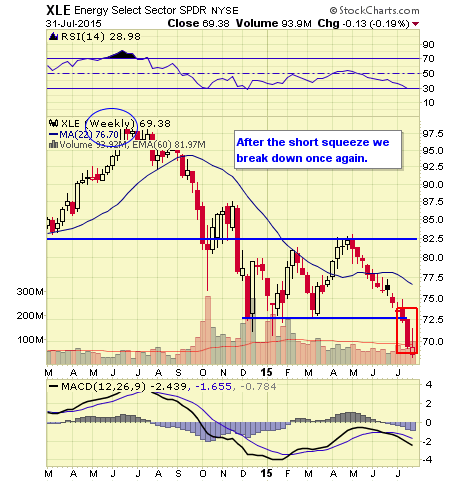
Energy has been a large drag on many large cap equity indexes. Many knew energy stocks were weak but the weakness had a larger impact than most expected. Exxon (NYSE:XOM) and Chevron (NYSE:CVX) reported profits down 50% which impacted markets negatively.
But that wasn't all that had a negative impact as the Employment Cost Index fell to only 0.2%, the worst wage growth in U.S. history. That in turn encapsulates the inescapable income inequality we read so much about.
Many on Wall Street acknowledge Fed policies among other things are to blame. Goldman Sachs honcho Lloyd Blankfein admits low interest rates have allowed people like him who have assets profited vs. many of those on Main Street who don't.
In addition, as we've been reporting the past few years, abundant corporate stock buybacks, financed by cheap interest rates, have made corporate earnings look better even if headline results don't impress overall.
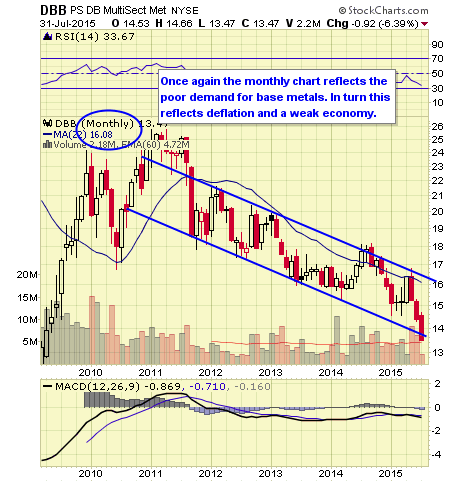
Meanwhile, commodity markets continue to telegraph deflation which the Fed doesn't acknowledge.
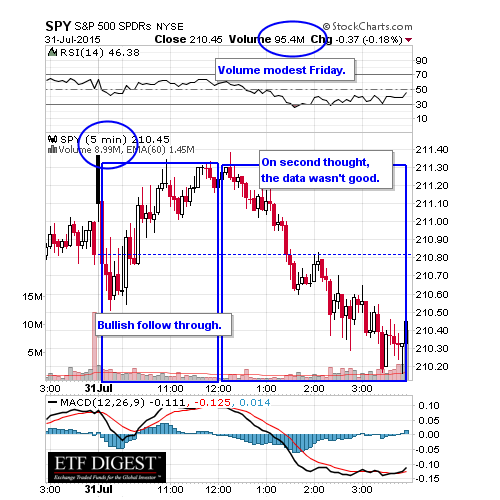
Stocks opened higher for the most part but as the day wore on the rally fell apart.
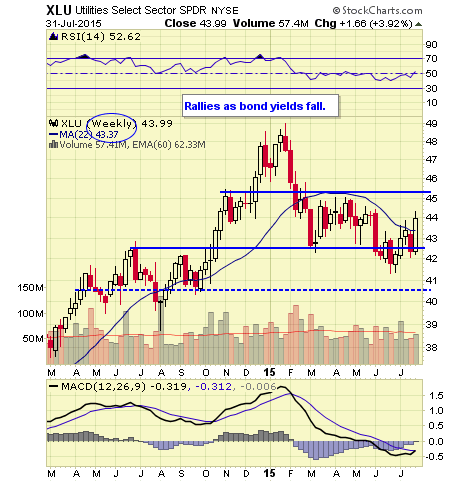
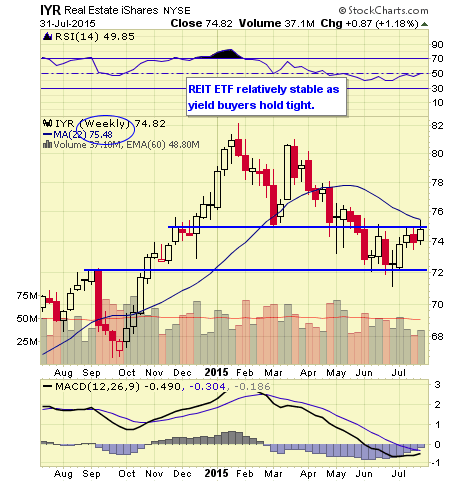
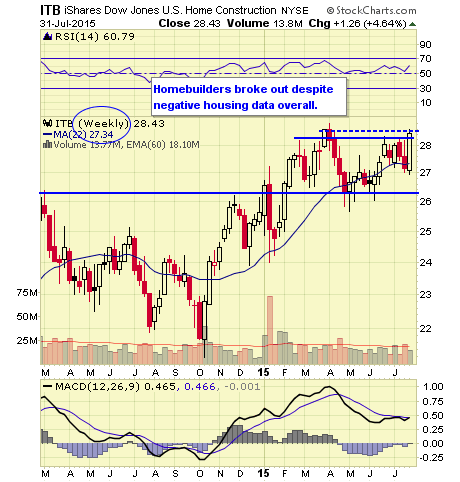
Leading market sectors higher included: Small Caps (NYSEARCA:IWM), Biotech (NASDAQ:IBB), Healthcare (NYSEARCA:XLV), REITs (NYSEARCA:IYR), Utilities (NYSEARCA:XLU), Homebuilders (NYSEARCA:ITB), Emerging Markets (NYSEARCA:EEM), EAFE (NYSEARCA:EFA), Europe (NYSEARCA:VGK) Germany (NYSEARCA:EWG), European Monetary Union (NYSEARCA:EZU), Japan (NYSEARCA:EWJ), India (NYSEARCA:EPI), Brazil (NYSEARCA:EWZ), South Korea (NYSEARCA:EWY), Mexico (NYSEARCA:EWW), Malaysia (NYSEARCA:EWM), Thailand (NYSEARCA:THD), Indonesia (NYSEARCA:IDX), Gold (NYSEARCA:GLD), Gold Stocks (NYSEARCA:GDX), Euro (NYSEARCA:FXE) , Corporate Investment Grade Bonds (NYSEARCA:LQD) and Treasury Bonds (NYSEARCA:TLT).
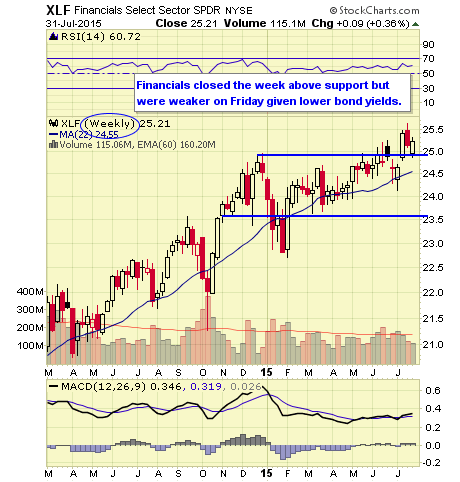
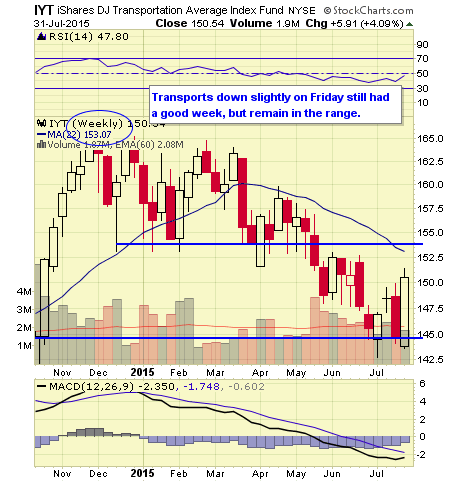
Leading market sectors lower included: Energy (NYSEARCA:XLE), Oil & Gas Exploration (NYSEARCA:XOP), Financials (NYSEARCA:XLF), Banks (NYSEARCA:KBE), Transports (NYSEARCA:IYT), Crude Oil (NYSEARCA:USO), Natural Gas (NYSEARCA:UNG) and Commodity Tracker (NYSEARCA:DBC).
The top 20 market movers by percentage change in volume whether rising or falling is available daily.
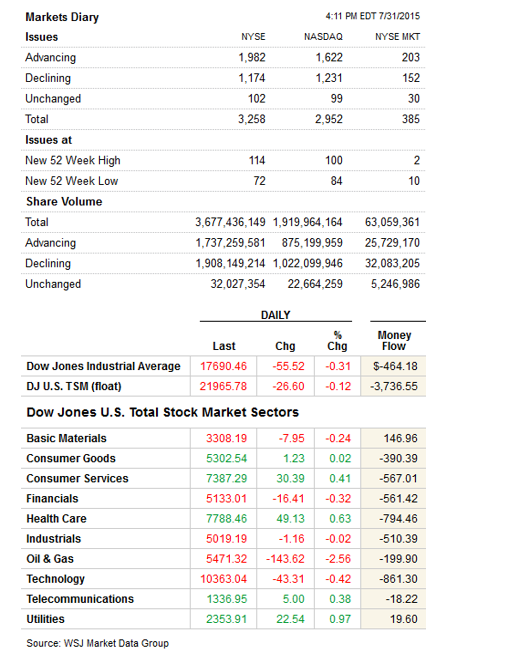
Volume was relatively light and breadth per the WSJ was positive. But one look at Money Flows (below) you'll be struck by the divergence.
SPY 5 MINUTE
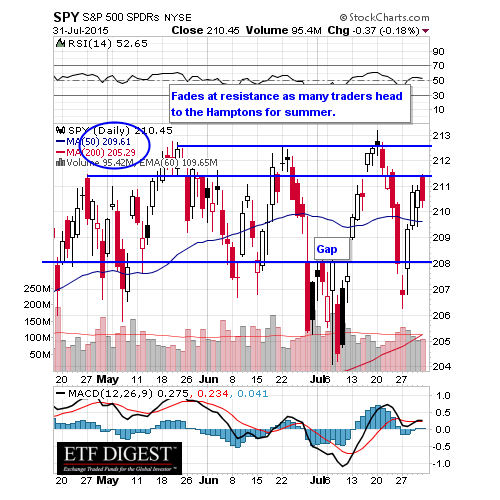
SPY DAILY
SPX WEEKLY
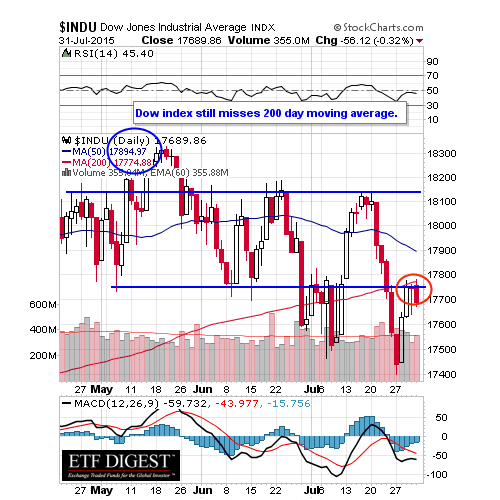
INDU WEEKLY
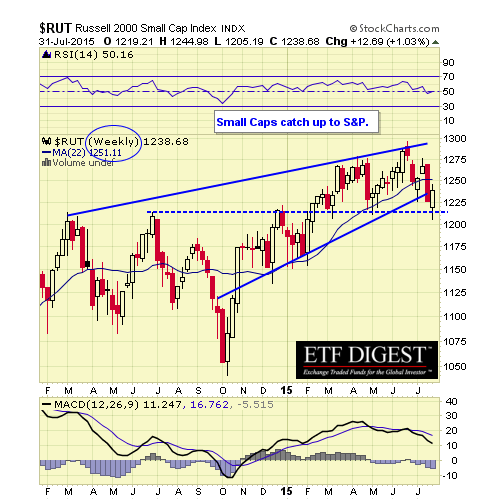
RUT WEEKLY
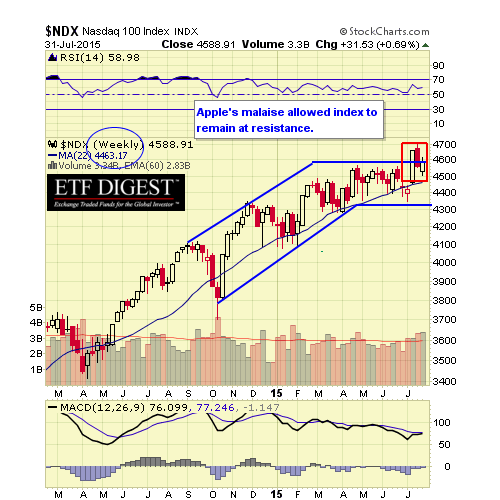
NDX WEEKLY
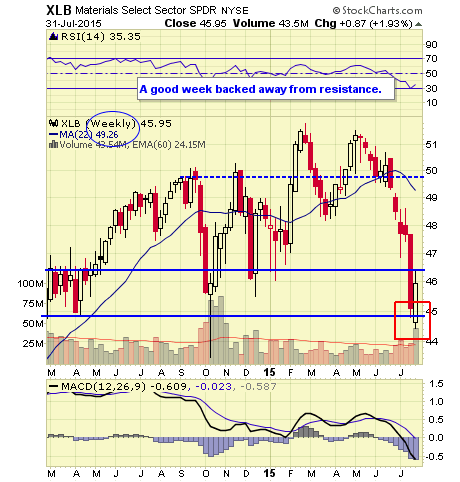
XLB WEEKLY
XLE WEEKLY
XLF WEEKLY
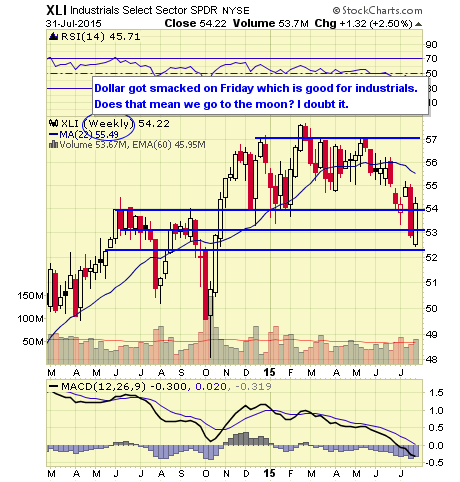
XLI WEEKLY
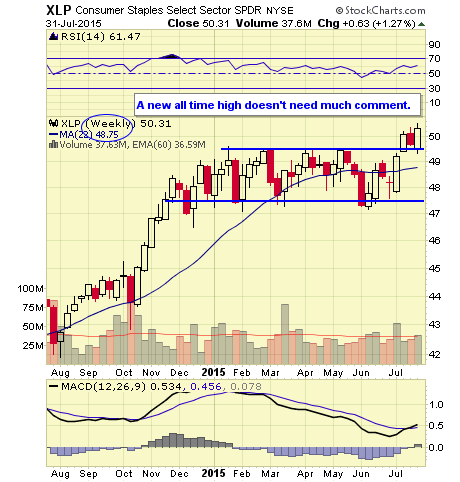
XLP WEEKLY
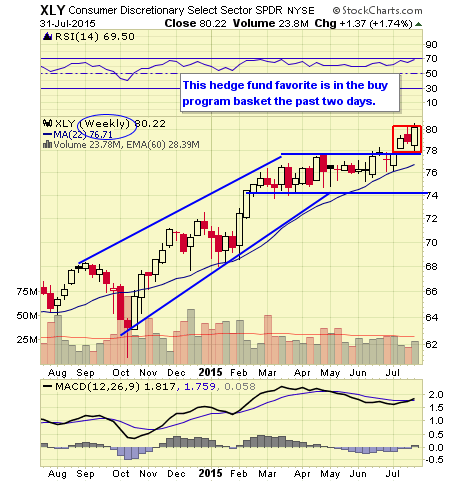
XLY WEEKLY
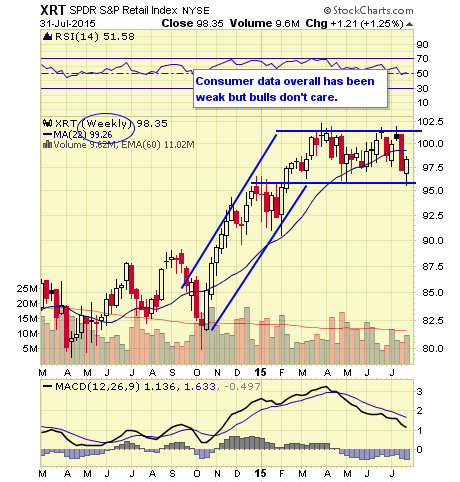
XRT WEEKLY
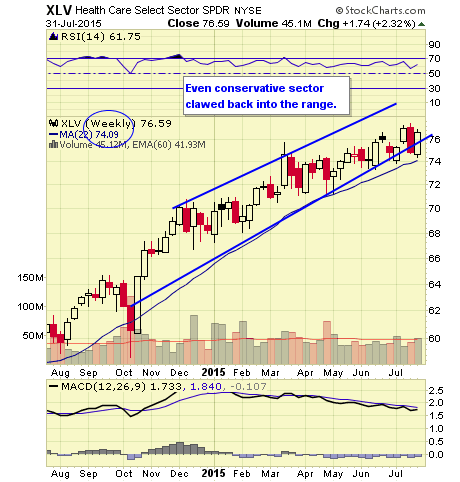
XLV WEEKLY
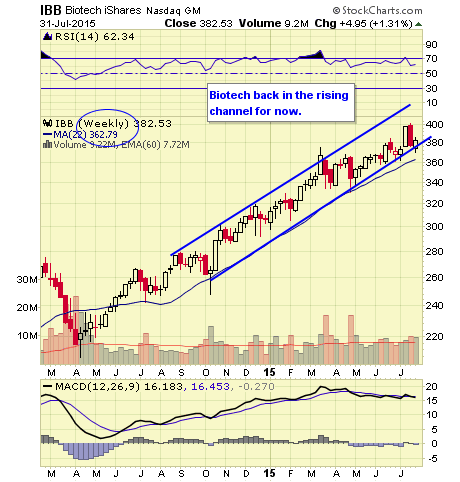
IBB WEEKLY
IYT WEEKLY
XLU WEEKLY
IYR WEEKLY
ITB WEEKLY
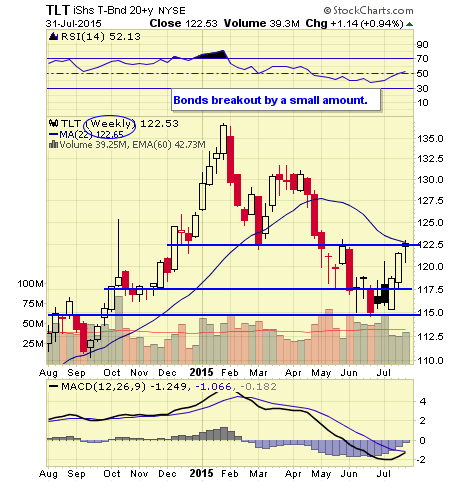
TLT WEEKLY
UUP WEEKLY
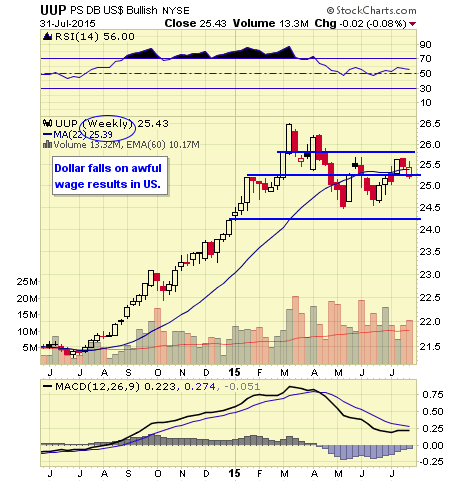
UUP
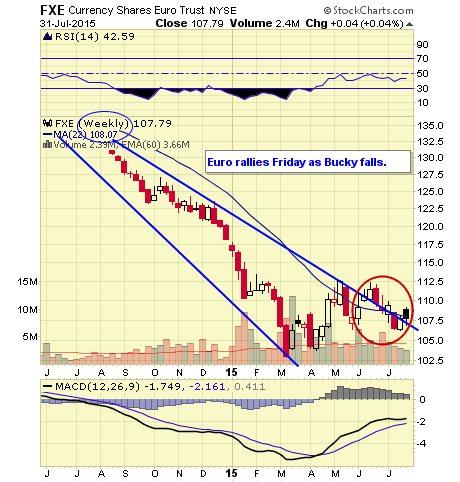
FXE WEEKLY
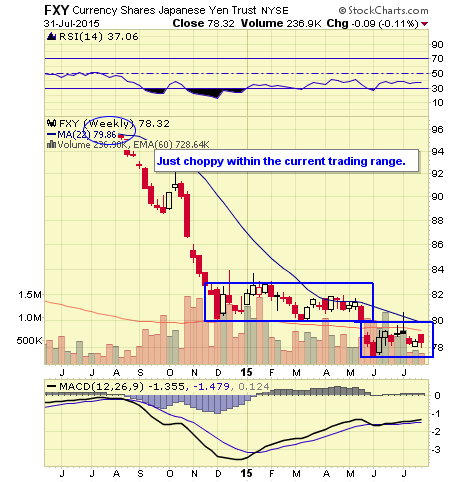
FXY WEEKLY
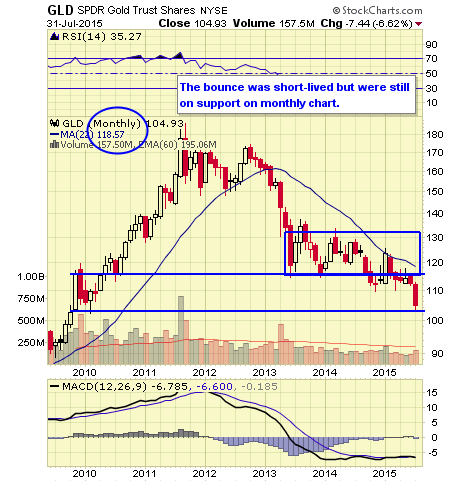
GLD WEEKLY
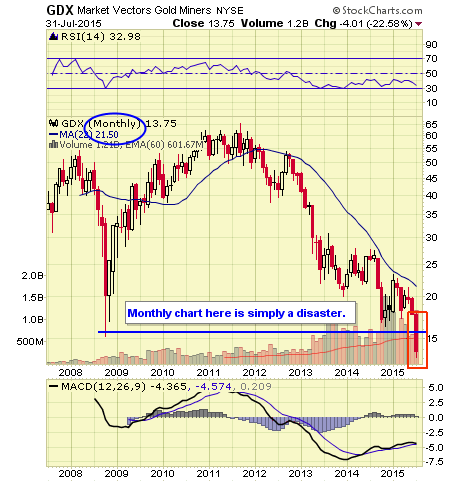
GDX WEEKLY
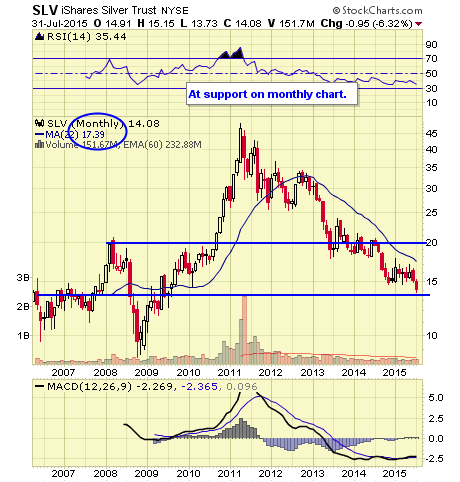
SLV WEEKLY
SLV
DBB WEEKLY
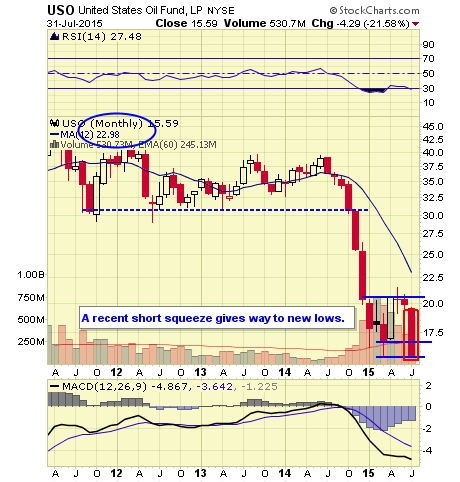
USO WEEKLY
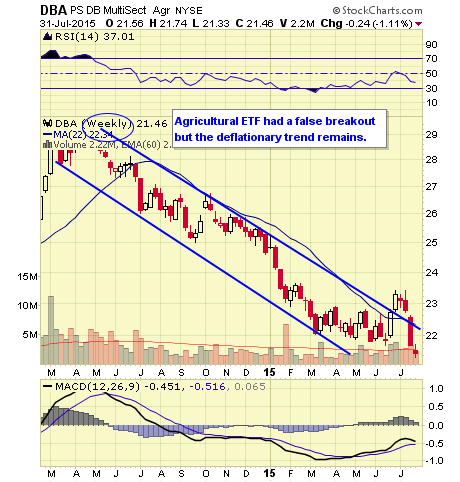
DBA WEEKLY
DBC WEEKLY
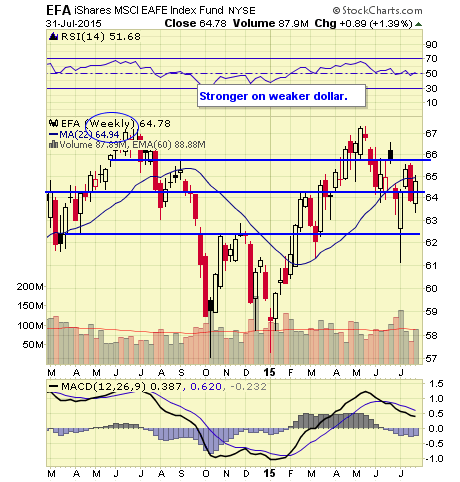
EFA WEEKLY
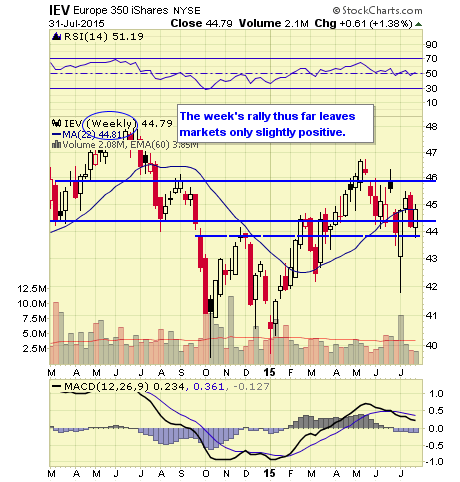
IEV WEEKLY
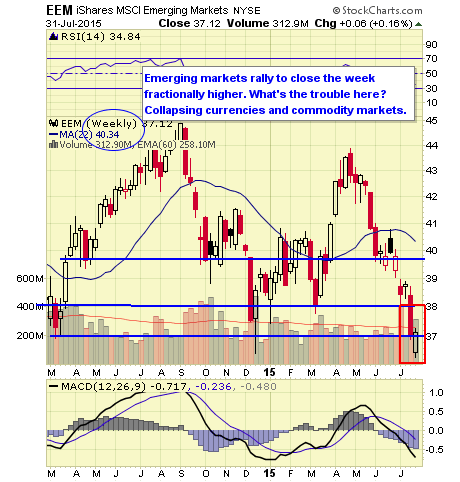
EEM WEEKLY
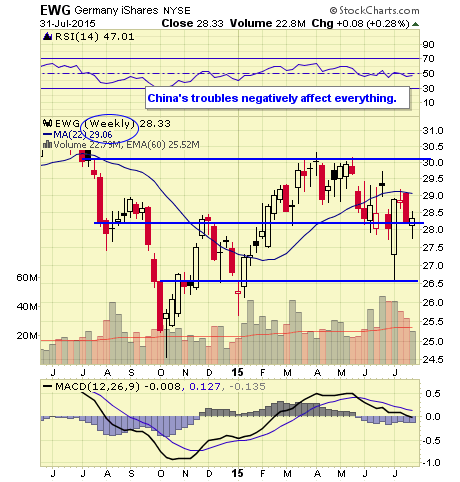
EWG WEEKLY
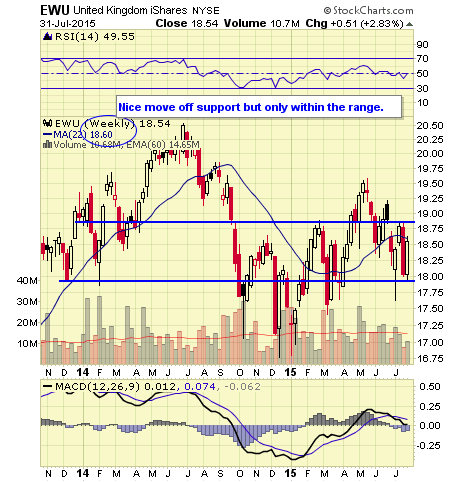
EWU WEEKLY
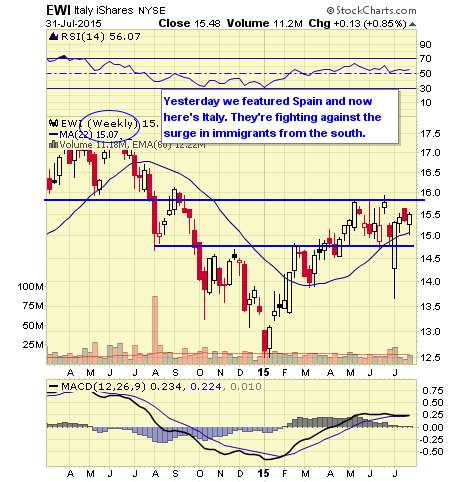
EWI WEEKLY
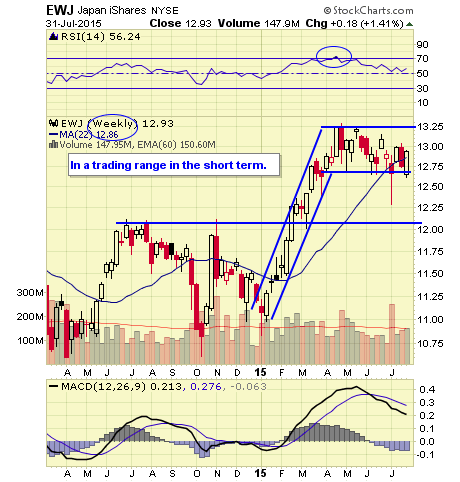
EWJ WEEKLY
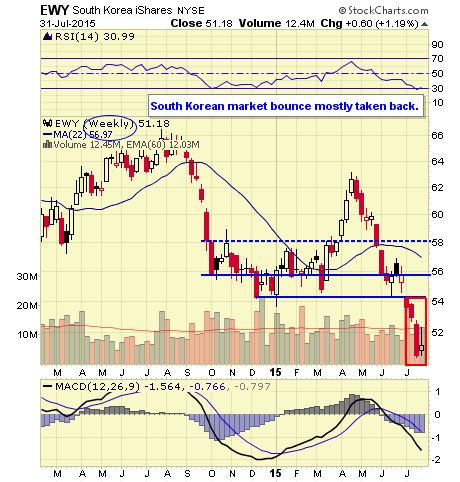
EWY WEEKLY
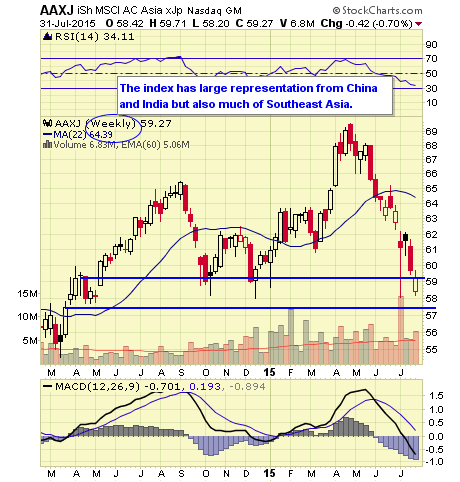
AAXJ WEEKLY
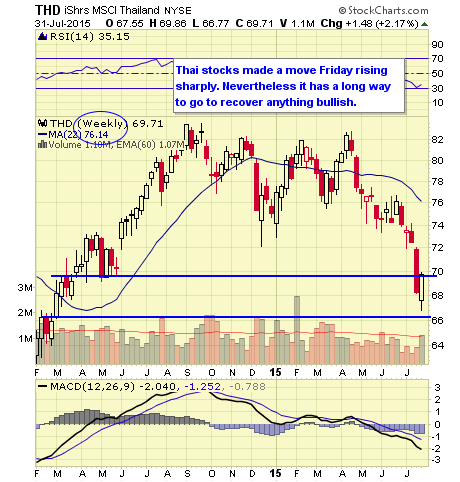
THD WEEKLY
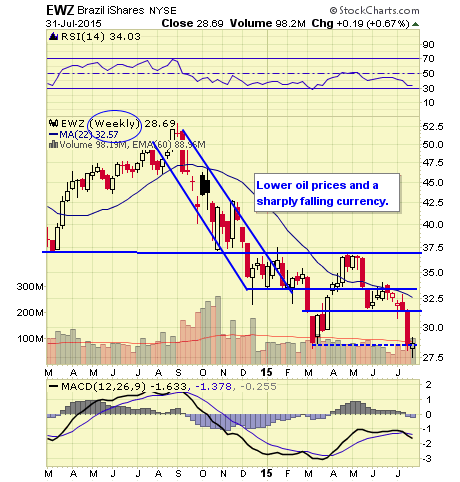
EWZ WEEKLY
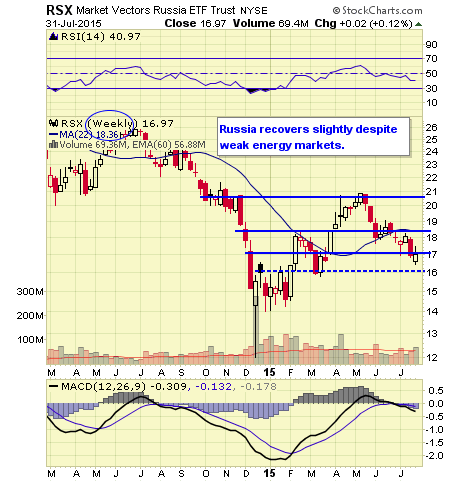
RSX WEEKLY
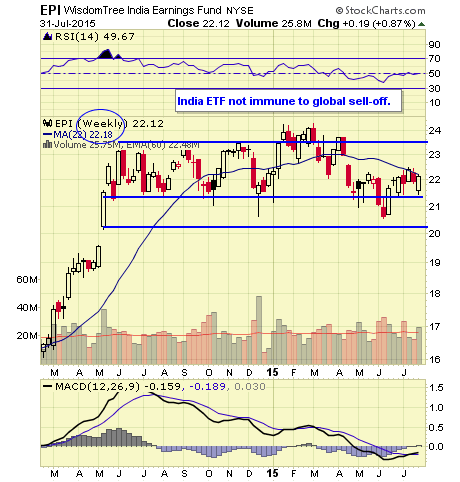
EPI WEEKLY
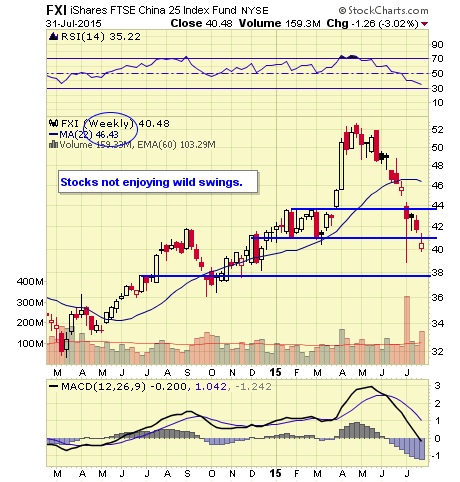
FXI WEEKLY
NYMO DAILY
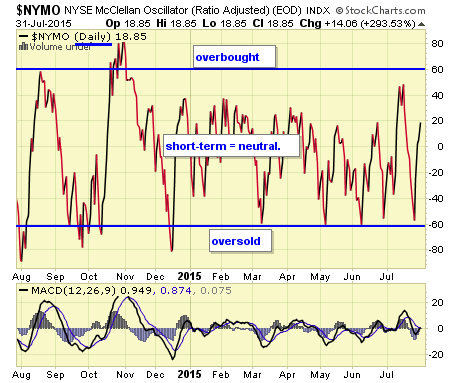
The NYMO is a market breadth indicator that is based on the difference between the number of advancing and declining issues on the NYSE. When readings are +60/-60 markets are extended short-term.
NYSI DAILY
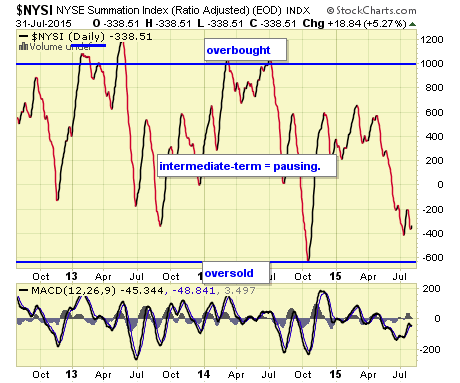
The McClellan Summation Index is a long-term version of the McClellan Oscillator. It is a market breadth indicator, and interpretation is similar to that of the McClellan Oscillator, except that it is more suited to major trends. I believe readings of +1000/-1000 reveal markets as much extended.
VIX WEEKLY
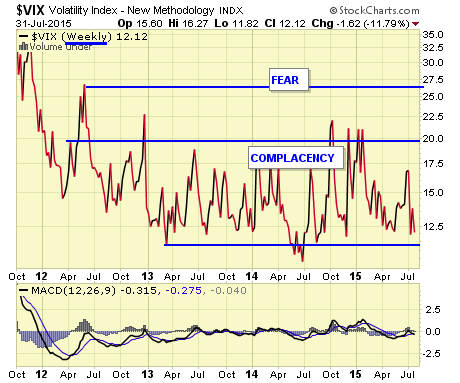
T
he VIX is a widely used measure of market risk and is often referred to as the "investor fear gauge". Our own interpretation is highlighted in the chart above. The VIX measures the level of put option activity over a 30-day period. Greater buying of put options (protection) causes the index to rise.
0 comments:
Publicar un comentario