2015 To 2020: Summary Of The Changing U.S. Age Demographics
Jason Tillberg
Aug. 7, 2015 11:27 AM ET
Summary
- US age demographics suggests weak growth in workforce age population.
- Overall population will grow 4.17% from 2015-2020 with the majority coming from the 65+ age group.
- Age demographics suggest sluggish overall economic growth for at least the next 5 years.
From 2010-2015, the population of the U.S. changed like this:
(click to enlarge)

Overall, the population grew 4.35% or 13.43 million people. The 65+ age group gained 6.556 million and represented 48.8% of the overall population growth.
Per the Bureau of Labor Statistics consumer spending survey, which can show household spending by the age of the head of the household, we can get an idea of the spending cycle of a person by their age:
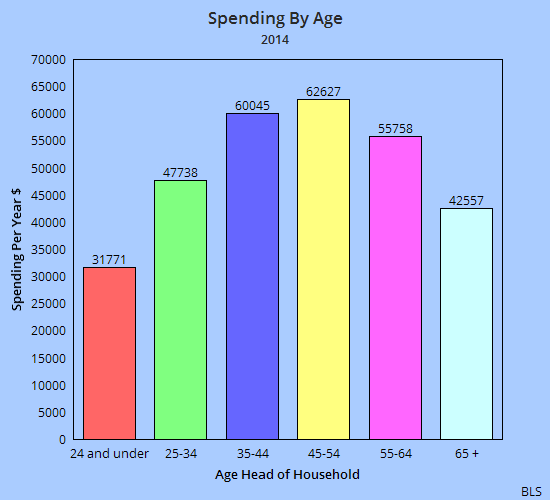
This chart above is from 3rd quarter of 2013 - 2nd quarter 2014.
The highest spending years are between the ages of 35 and 54, the child raising years. Upon reaching 55 and up, spending begins to decline and falls off especially in the 65+ age group.
So to give a summery to the population change from 2010-2015, while there was significant growth in the 65+ age group, there was still some growth in both the 25-44 and 45-64 age groups, 2.51% and 3.33% respectively. It is these age group that are the biggest spenders for the economy. However, the growth rates of those two age groups was below average. The 18-24 age group actually declined 1.58%.
The working age population of 18-64 year olds grew just 2.21%.
Overall, these were unfavorable changes in the age of the U.S. population from an economic growth standpoint.
The next 5 years should prove even more unfavorable.
2015-2020
The overall population of the U.S. will grow 4.17% from July 2015 - July 2020 to 335,804,000. However, the rates of change vary quite substantially by age group.
Here is a chart of the U.S. population and projections:
(click to enlarge)
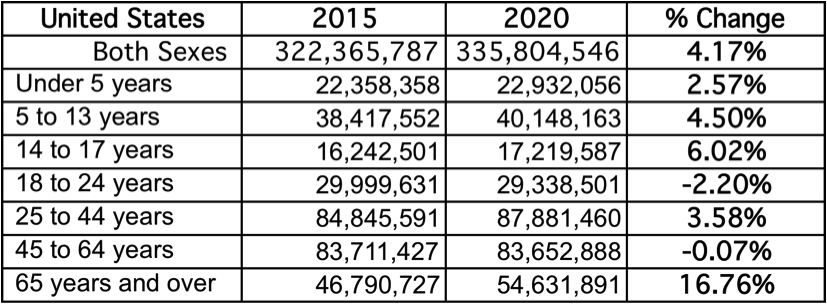
Source for population projections taken from U.S. Census Bureau, 2005 interim state population projections Table C1.
The 18-24 year age group will see a decline again, this time 2.2%. We're going to see above average growth in the number of 5-17 year olds over the next 5 years. That age group will grow 5%. (I've got a 2 and 4 year old now that will be jumping into that category by 2020).
The aggregate growth in the number of American's between the ages of 18 and 64, the age when we're likely to be working, raising kids, and in our peak spending years, will only grow 1.17% over the next 5 years. That's a little less than 0.23% per year.
The age group 45-64 will actually be seeing a decline of 0.07%.
Meanwhile, of the 4.17% growth in the U.S. population that is expected in the next 5 years, which is 13.438 million new persons, 7.841 million will be added to the 65+ age group.
The 65+ age group will make up 58% of the overall population growth over the next 5 years.
This same age group saw the biggest rise in the previous 5 years as well.
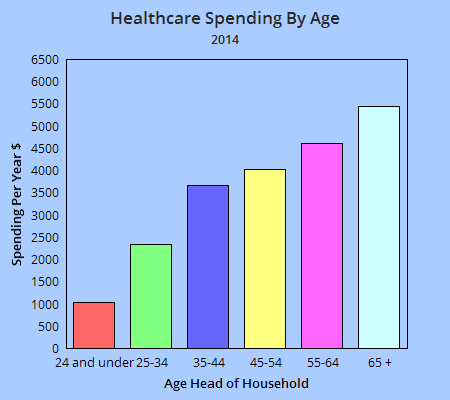
The industry where age plays the greatest factor is the healthcare industry. Below is spending by age of the head of household on healthcare. The older the population, the more spending on healthcare.
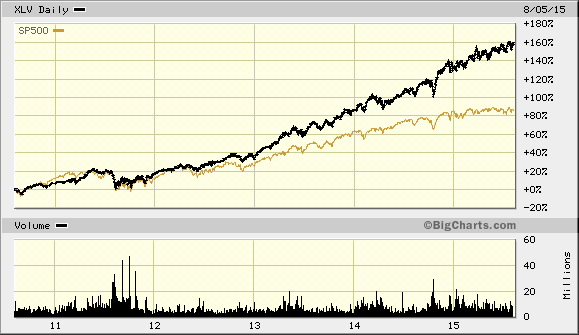
Very favorable demographic trends have been in place for the healthcare industry. The Health Care Select Sect SPDR ETF (NYSEARCA:XLV) has steaditly outpaced the SPDR S&P 500 Trust ETF (NYSEARCA:SPY) over the last 5 years now.
This favorable demographic trend is set to continue for the next 5 years as well. For the overall U.S. economy, the demographics are unfavorable for growth.
Here is a terrific chart from the Bureau of Labor Statistics that shows labor force participation rates by age and also offers a forecast for the year 2022:
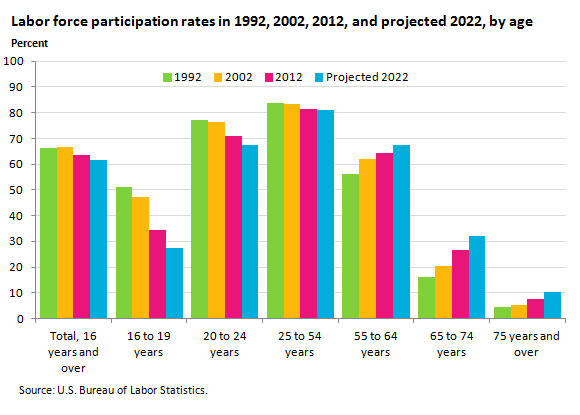
The overall labor force participation rate is expected to go to 61.6% by 2022. As of June 2015, it stood at 62.6%.
When we couple both expected declining labor force participation rates and very slow population growth of 18-64 year olds, we can fully expect that overall employment in the U.S. will be below 0.5% per year for the next 5 years at least.
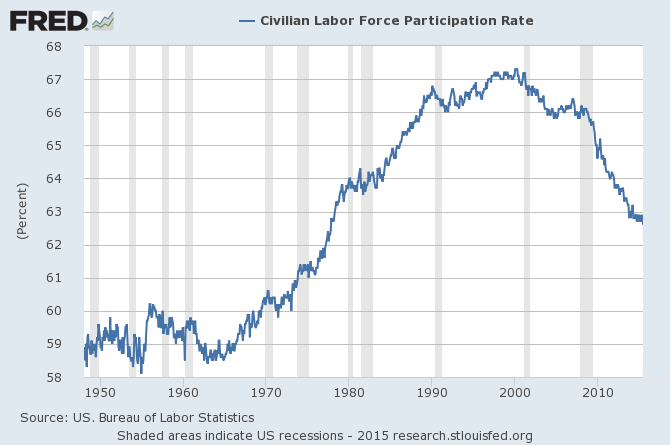
Here is a long terms monthly chart of the civilian aged 16+ labor force participation rate:
(click to enlarge)
Conclusion on age demographics:
Have very low expectation for economic growth in the U.S. economy for the next 5 years based on:
- A very slow growing working age population.
- A declining overall labor force participation rate.
- The starting point of a low 5.3% unemployment rate as of June 2015.
0 comments:
Publicar un comentario