Gold Makes New Bear Market Lows
by: Ben Lockhart
Jul. 20, 2015 2:06 AM ET

Summary
- Gold made new bear market lows this week, as did the major mining indices.
- The move lower came on the announcement that China has not been buying anywhere near as much gold as many had estimated.
- Although in the very short term we may drop a little further, both gold and the miners have strong support just below and we may soon see an oversold bounce.
For the week gold lost just over 2.5% and the miners just under 8%, with both showing signs that the decline is not yet over in the immediate term. However both have strong support levels just below, and I would therefore not recommend initiating new short positions at this juncture as there is likely to be at least a small relief rally in the not too distant future.
I will cover those potential bounce targets a little later on, but first we should take a minute to talk about the other big piece of information making the news within the gold sphere this week, as the outside edges of the price decline puzzle may have just been filled in for us.
4 Years of Bullish Fundamental Reasoning Evaporates in 30 Seconds
To precious metals suppression theorists, a core tenet of the argument is the 'massive buying' of gold by China. How could the price be falling when the PBoC are buying so much gold? That argument was dealt a huge blow this week as China disclosed its official gold reserves for the first time in 6 years, and the total was well below that of consensus estimates.
The figures show that China has purchased 604 tonnes of gold since April 2009, taking its total holdings to 1,658 tonnes (less than the reserves of Italy or France) and at today's gold price that represents just 1.6% of its total foreign exchange reserve holdings. In fact, analysis of its foreign exchange reserves show that China is the biggest holder of the US Dollar globally with over $3T on its books.
Back in April of this year Bloomberg estimated that China to hold over 3500 tonnes of gold, so you can well imagine that the official figures released on Friday struck a major blow to the bullish fundamental thesis, and the announcement propelled gold lower. The PBoC themselves had this to say on gold:
"Gold has a special risk-return characteristic, and at specific times is not a bad investment.. Gold is the same as other commodities and financial assets, the global price rises and goes down.. based on our analysis on gold's value and price changes, and on the premise of not creating disturbances in the market, we steadily accumulated gold reserves through a number of international and domestic channels.."
The comments made by the PBoC were telling for a number of reasons. The first is that they are obviously not buying indiscriminately regardless of the price - they wish to buy at the cheapest price like everybody else does. The second is that they see it as a commodity rather than a currency - somewhat at odds with the GATA view; and the third is that they understand that the gold market is small and they do not wish to distort the true value by making large bulk purchases - hardly the outlook of a country intent on dethroning King Dollar and asset backing their own currency.
Doubtless there will be articles written stating that the figures are wrong, in fact we are already seeing reports of people hinting that the Chinese have low-balled their official figures, but to those thinking logically about the decline from 2011 onwards the answer has always been simple - the price is falling because demand is not outpacing supply, regardless of how much is being allegedly bought up by China, India and Russia.
Many of the gold newsletter writers and prominent gold analysts - analysts that have mostly maintained a bullish stance throughout this bear market - are the ones casting doubt, but I would urge people to step back and see the whole picture. Just a few weeks back the same people were telling us that the dwindling Swiss Customs export figures were incorrect, and were pointing to the SGE withdrawals stats as the proof that Chinese demand was actually rising. It beggars belief that they would now say that the Chinese figures have been under-reported. Some people will never admit they were wrong.
In investing it is important to view a price trend as it is rather than what you want it to be, and in the precious metals arena we see a series of lower highs and lower lows that mark a clear downtrend. If you only had the chart to look at and knew nothing else of the gold market, you could assume that the fundamental landscape of supply/demand/sentiment is bearish given that price is falling.
Investing solely on fundamentals is difficult as you never truly know if you have the fundamental landscape pegged, and Friday's announcement is a perfect example of this. Many raging bulls would have been TKO'd when this report was released. Fundamentalists ignore charts, but then a chart is representative of all the fundamentals that brought price to this exact moment. Price is truth.
Despite the decidedly bearish news there is one clear positive. When the tide turns and gold makes its first higher high on the chart, we will have a potential willing buyer here with the ability to propel the price upwards in short order. At the end of 2014 central banks globally held an average of 10% of their reserves in gold - should China start to play catch up and increase the amount they hold from the current 1.6% level, price could simply rocket higher.
However, at the present time it is clear that the Chinese are ignoring gold in favor of the dollar - perhaps you should do the same until they change their stance?
Data Points
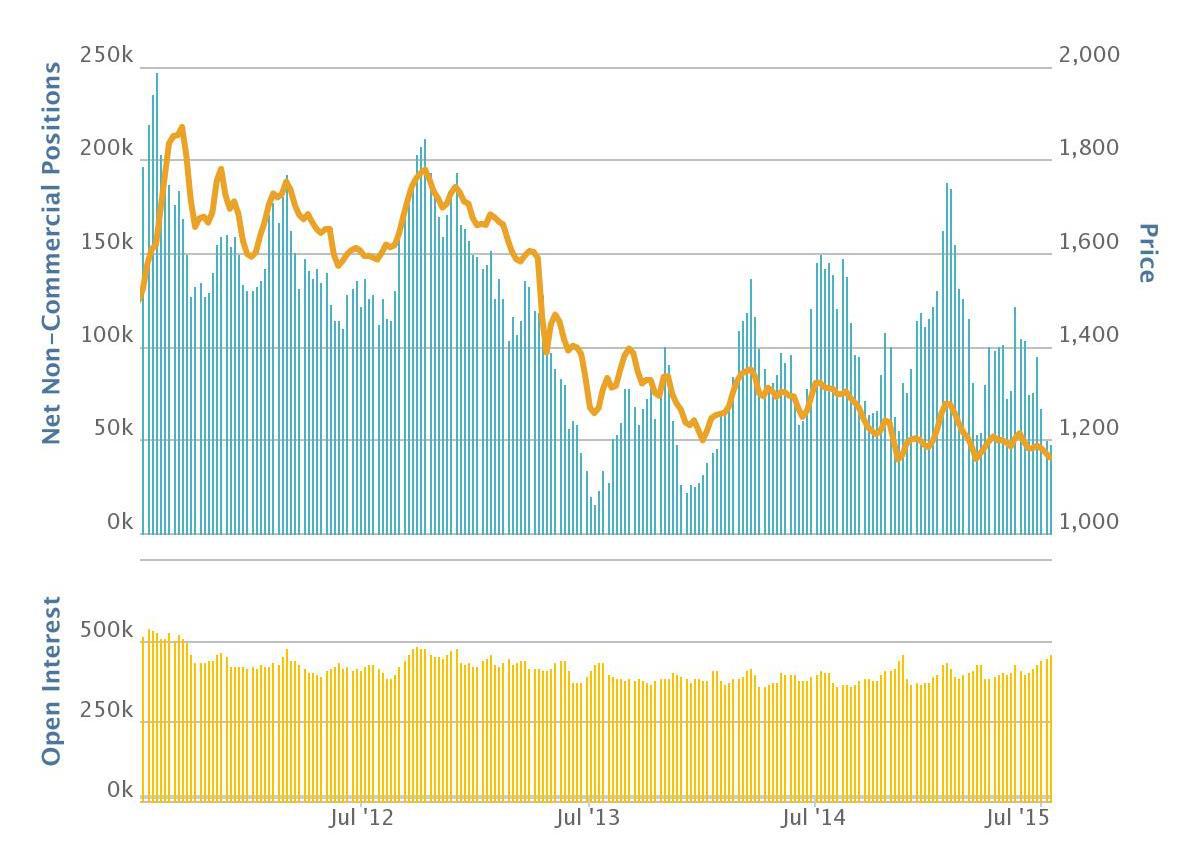
The latest figures from the Commitment of Traders report are below:
| COMMERCIAL | LARGE SPECS | SMALL SPECS | |||
| LONG | SHORT | LONG | SHORT | LONG | SHORT |
| 183,945 | 232,414 | 191,014 | 143,190 | 36,195 | 35,550 |
| CHANGE | CHANGE | CHANGE | CHANGE | CHANGE | CHANGE |
| +11,393 | +7,273 | -2,762 | -138 | -1,616 | -120 |
Quite an interesting report this week in the respect that the Commercial trader category took the opportunity to add a fair number of long and short positions, while the other categories made little change.
Since the speculator categories got effectively more net short (they sold long contracts), we can see a corresponding number of long contracts added on the commercial side, but this week they have actually added 7,000+ hedges which allowed them to increase their long holdings further whilst maintaining their overall position. When gold is approaching its bear market low I am expecting to see the speculators net short and the commercial traders net long. Could they be preparing for this now by increasing their inventory? Only time will tell.
The latest chart is below, and yes we are most certainly reaching a point where we could see a little bounce. This is an inflection point now, and certainly not the time to be initiating new positions - better to wait for support to either hold or break before you make your move.
(click to enlarge)
*courtesy of OANDA
One final comment - gold made the bulk of its move lower after the data for this report was compiled (it runs Tuesday to Tuesday), so unless we see a very sharp move higher on Monday you can expect to see the speculators get further net short by the time the next report is issued.
A short covering bounce is probably not very far away.
US Dollar
A few weeks back in the comments section I stated that the dollar (NYSEARCA:UUP) should now rally to 98+ on the DXY chart, and we are now approaching that price level:
(click to enlarge)
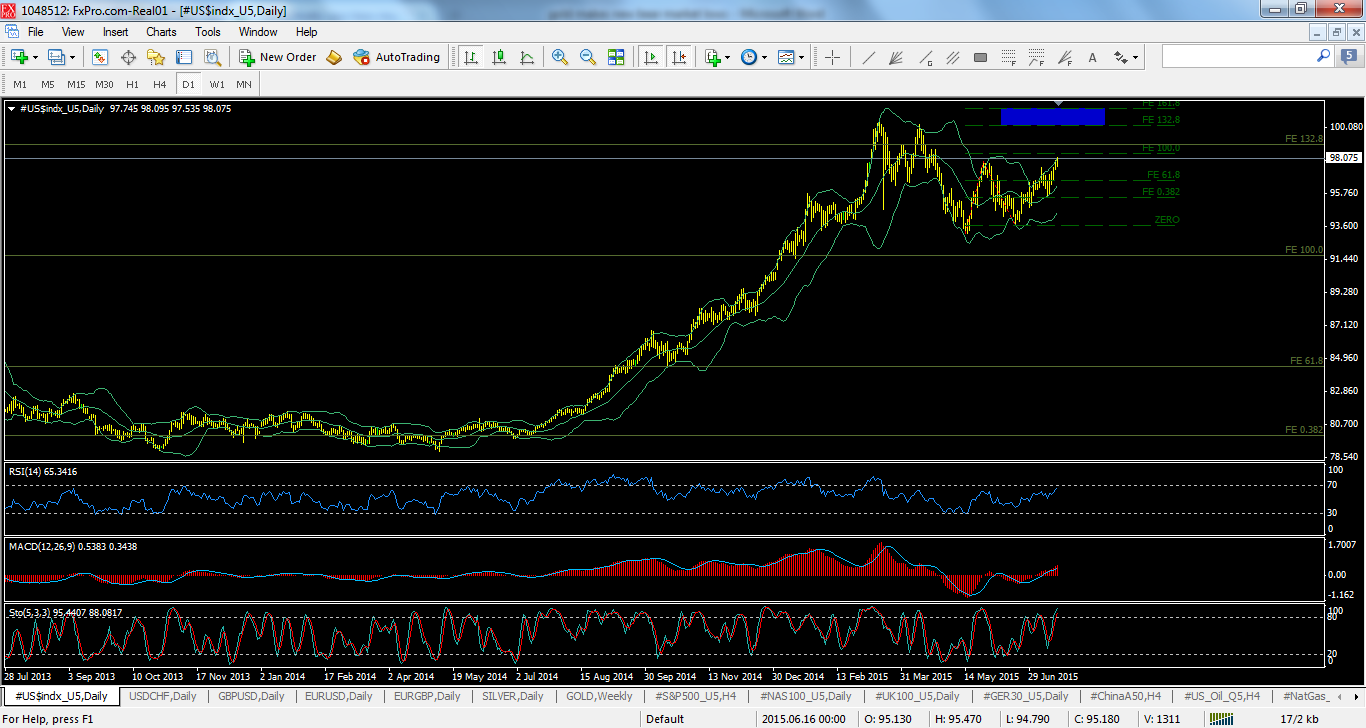
Regular readers will know by now that I am a huge dollar bull, and expect to see much higher levels in the next year or two. There is a chance that we have now completed the correction and are starting to break to new highs, but it is equally probable that we retest the highs (blue box 100.20-101.30) before dropping back to roughly 94 and then resume our march higher.
If we retest the highs then drop back, this will give gold the chance to bounce a little before making new lows. The key level in the dollar is therefore 101.30 - a solid break above this level would indicate we are heading to at least 103 and more probably higher, and would heap the pressure on gold; but a failure at the blue box or below may give gold the chance to shine for at least a short while longer.
Miners
The miners broke support this week, taking out their previous bear market lows with ease and setting the stage for gold to move lower:
(click to enlarge)
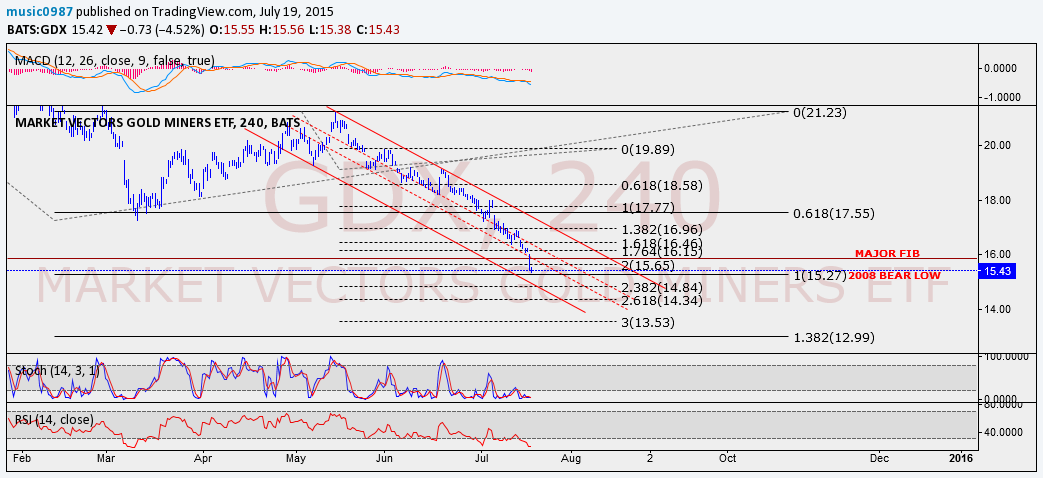
As with gold they do have very strong potential support just a few percent below, and I would not expect this support to be violated by anything more than a quick spike on the first attempt. The 2008 gold miners bear market low stands at 15.24 and we have trend line support at 14.84 and I am looking for a bounce in that zone ideally.
Should that play out with gold making a corresponding low and the dollar a short term top, we may see a rally start to unfold. Doubtless we will be told that this time the low is in, but I lean towards this being just an oversold bounce with a further low to come.
The target for a bounce in GDX would be towards 19, but this depends on where we make the low itself, and could be slightly higher or lower as a result. I will calculate targets if/when a bounce starts to materialize.
I shouldn't have to tell you that a clear break of this support without an immediate reversal back above would be extremely bearish for the miners, and may result in further capitulation towards my ultimate bear market target of 10. Bulls need to be careful.
Gold
Gold made new bear market lows, but not by much, which shows we didn't see a raft of panic selling take place when it encountered its November 2014 low. There again we did not see any kind of persistent buying either:
(click to enlarge)
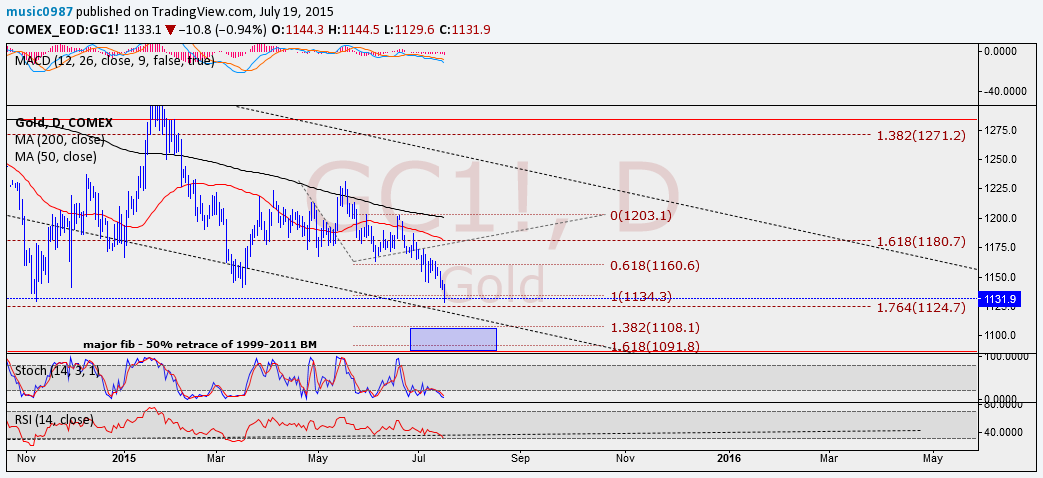
Short term support stands at $1132, $1125, $1108 & $1100, but the major support is the 50% retrace of the 1999-2011 bull market at $1086. That is a support level I would not expect to see broken on the first attempt. It lines up well with the target for a bounce in GDX and I would expect us to make a tradable low on or around that level.
Zooming out to the weekly chart we can see that the technicals are mixed with the MacD indicator showing a bearish crossover, but the stochastics and relative strength index showing oversold readings that may mean they are potentially at support:
(click to enlarge)

As with GDX, if we were to see a strong move through the above support levels and did not immediately reverse higher, we could see a capitulation event in gold. The next support level below $1086 is $1035 followed by nothing much until we hit $900.
However, my primary expectation is that we see a tradable low somewhere in this region and a quick bounce higher before we make further new lows. The target for the bounce can only really be calculated when the first couple of waves higher are in place, but in broad terms I think if we were to make the low at $1086, we could well see a bounce toward $1180.
Although I expect gold to head below $1000 before the bear market concludes towards year end, $1086 is the first price level at which I would legitimately consider the low being in for gold.
Obviously we would have to see a very strong impulsive move from that level for me to take that view, but many investors have lost money waiting for one more low that never came, so if you have an investing timeframe of 5+ years, you should probably be buying at least part of your inventory now.
As usual I will update thoughts in the comments section as the count progresses, and I wish you all good luck for the coming week!
0 comments:
Publicar un comentario