Jun. 13, 2015 11:14 AM ET
by Sumit Roy
The outlook for oil prices has seldom been as uncertain as it is now.
The Department of Energy reported this morning that in the week ending June 5, U.S. crude oil inventories decreased by 6.8 million barrels, gasoline inventories decreased by 2.9 million barrels, distillate inventories increased by 0.9 million barrels and total petroleum inventories decreased by 0.6 million barrels.
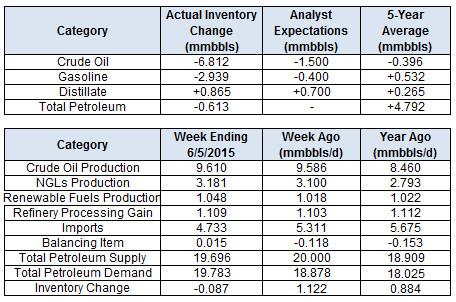
Crude oil prices were up, but off their highs following the release of the latest inventory figures. Bulls were heartened by the big drop in crude stockpiles, but dismayed by the continued increase in U.S. production.
Output in the United States rose by 24,000 barrels per day last week to 9.61 million barrels per day, the highest level in more than 40 years.
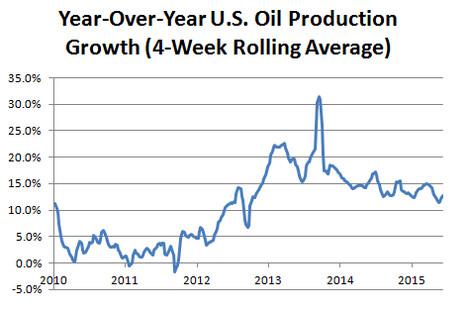
U.S. production is proving to be much more resilient than many had expected, a reflection of efficiency gains and oil companies simply doing more with less. It's been eight months since the rig count peaked, yet output growth hasn't even slowed down, let alone reversed.
On a four-week rolling basis, U.S. production growth remains well in the double-digit range and comparable to where it's been during the past couple of years at 12.7 percent.
That said, last week's crude inventory withdrawal was due to a drop in imports to around their lowest levels of the year. With U.S. stockpiles near record levels, refineries have little need to purchase crude from overseas; thus, the latest draw is not necessarily as bullish as it may seem on the surface.
While fundamentals continue to weigh against the oil market, the technical picture is a different story. Both Brent and WTI are holding up well following the big surge in prices during the spring.
BRENT
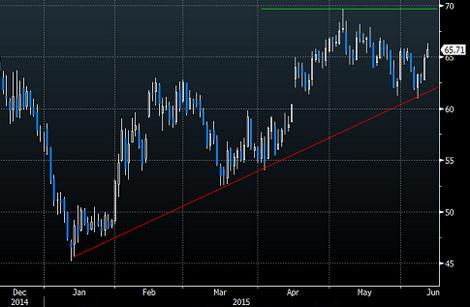
WTI
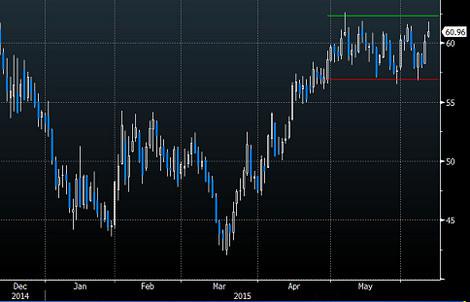
WTI is at the top of its upper-$50s to lower-$60s range, while Brent is in the middle of its recent price band. From a purely technical perspective, both benchmarks look poised to run higher. However, the aforementioned fundamental factors may keep prices in check.
Thus, the outlook for crude prices in the short term is very uncertain and mixed, with fundamentals pointing lower and technicals pointing higher.
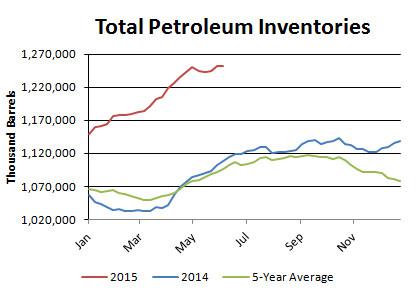
Turning to this week's EIA inventory figures, total petroleum inventories in the U.S. decreased by 0.6 mmbbl, against the five-year average of a 4.8 mmbbl increase. In turn, the inventory surplus decreased to 155.1 mmbbl, or 14.2 percent, against the five-year average.
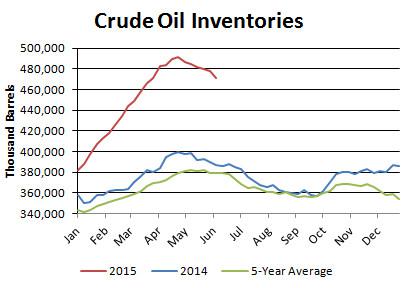
Crude oil inventories fell by 6.8 mmbbl, against the five-year average of a 0.4 mmbbl decrease. In turn, the surplus in the crude category narrowed to 91.8 mmbbl, or 24.2 percent.
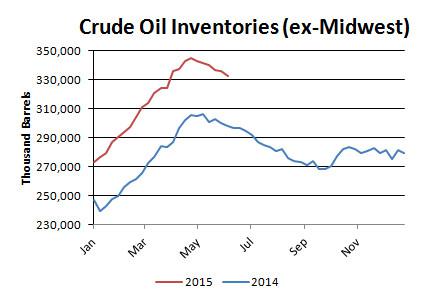
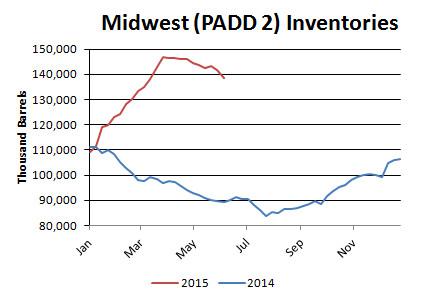
Regionally, inventories inside and outside the Midwest fell.
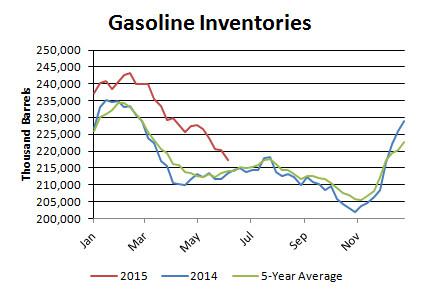
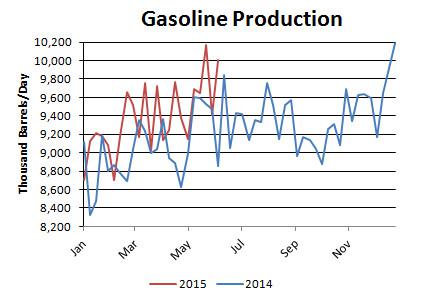
Gasoline inventories fell by 2.9 mmbbl against the five-year average of a 0.5 mmbbl increase.
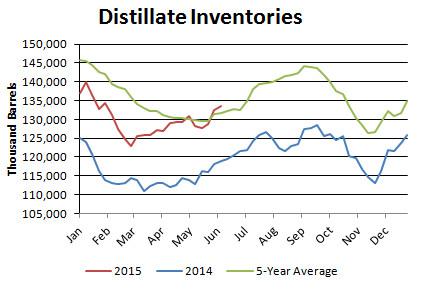
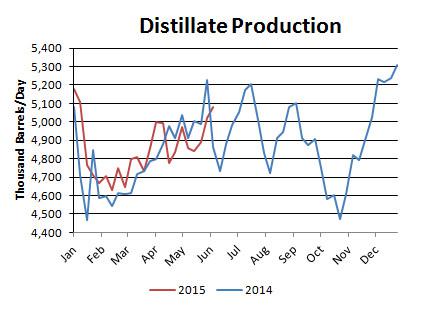
Gasoline inventories now have a surplus of 3.3 mmbbl, or 1.5 percent. Distillate inventories rose by 0.9 mmbbl against the five-year average of a 0.3 mmbbl decrease. In turn, the distillate deficit now stands at 1.8 mmbbl, or 1.4 percent.
Demand
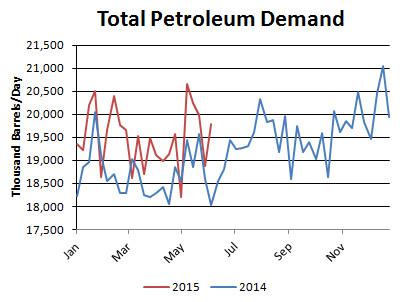
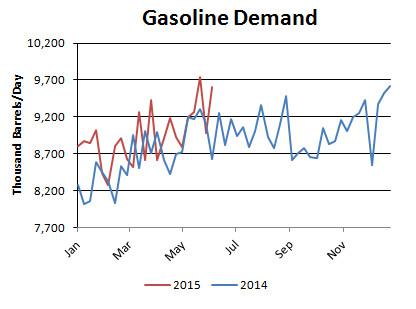
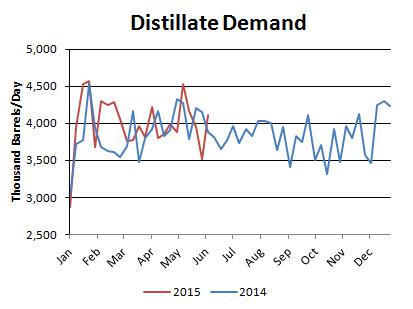
Total petroleum demand in the U.S. climbed to 19.8 mmbbl/d, while gasoline demand surged to 9.6 mmbbl/d and distillate demand increased to 4.1 mmbbl/d. On a four-week rolling basis, total demand was up by 5.1 percent from last year. On that same basis, gasoline demand was up 3.8 percent and distillate demand was down by 1.7 percent.
It's worth noting that these figures may be overstated due to the EIA's methodology for calculating demand.
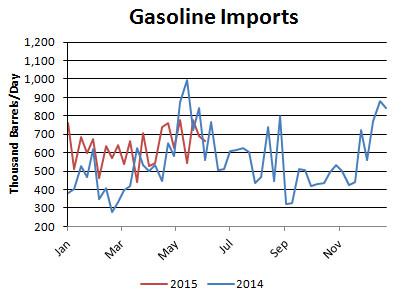
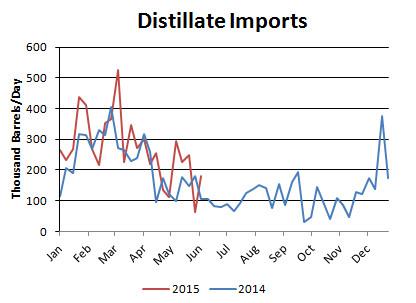
Imports
Crude oil imports fell by 0.8 mmbbl/d to 6.6 mmbbl/d. On a four-week rolling basis, imports have averaged 2.3 percent below the year-ago level.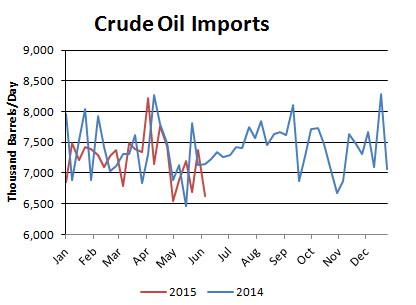
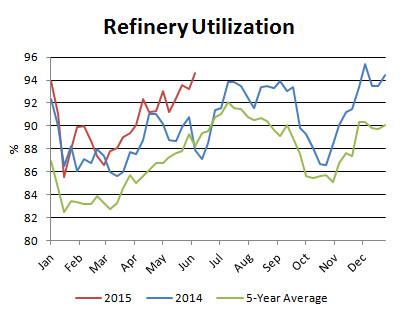
Refinery Activity
Refinery utilization ticked up from 93.2 to 94.6 percent. Utilization is above the year-ago level and above the five-year average. Gasoline production jumped to 10 mmbbl/d, while distillate production edged up to 5.1 mmbbl/d.
Miscellaneous
U.S. crude oil production climbed to 9.61 mmbbl/d, up 24,000 barrels per day from the previous week and the highest level in more than 40 years. Since the start of the year, output has averaged 1.1 mmbbl/d, or 13.5 percent, above the same period a year ago.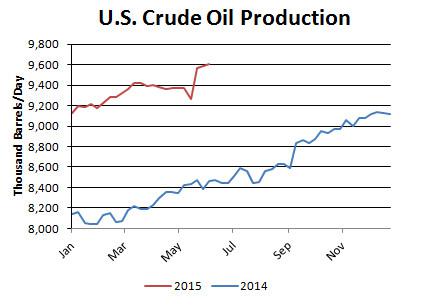
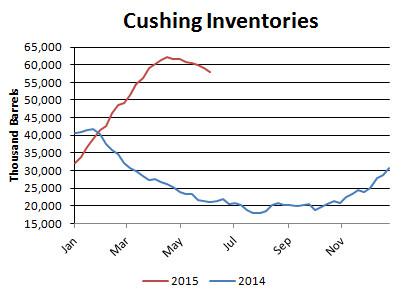
Inventories at the Nymex delivery point in Cushing, Oklahoma, fell by 1 million barrels to 58 million barrels, or 67.6 percent, of the EIA's estimate of capacity. Overall, Midwest inventories fell by 3 million barrels to 138.5 million barrels, or 81.6 percent, of estimated storage capacity.
Front-month WTI calendar spreads remained in contango at +$0.47.
Front-month Brent calendar spreads remained in contango at +$0.58.
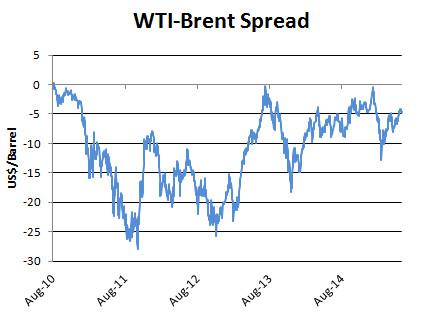
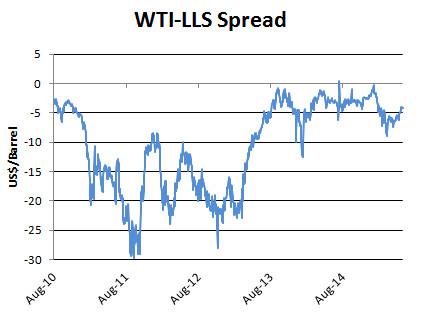
West Texas Intermediate's discount to Brent increased week-over-week from -$4.16 to -$4.69. WTI's discount to Louisiana Light increased week-over-week from -$4 to -$4.20.
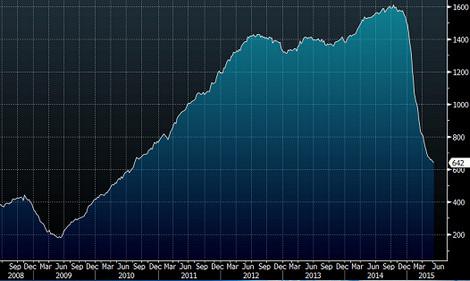
The Baker Hughes oil rig count decreased by four to 642 last week.
Baker Hughes Oil Rig Count
0 comments:
Publicar un comentario