Apr. 24, 2015 11:43 AM ET
Summary
- 5 of the 6 historically-worst performing months of the year are during the 5-month stretch from May to September.
- Historically, it’s still been good to hold stocks during this period as only September has averaged a negative return.
- Many believe that the Fed will raise interests rates in September of this year, making this trend particularly pertinent.
We'll also analyze how individual sectors perform throughout the year, by comparing the returns of each of the S&P sector indexes from 1997 to 2014.
There are a wide variety of "seasonal" anomalies that have been discovered in the financial academic community, such as the "turn-of-the-month" effect - whereby there are abnormal increases in stock prices at the end of each month, as pension funds reinvest new savings into the market. While some of these anomalies may only offer a small edge, there are a number of revealing insights that investors would be wise to learn. This article aims to provide an overview of some of the cyclical trends of the market.
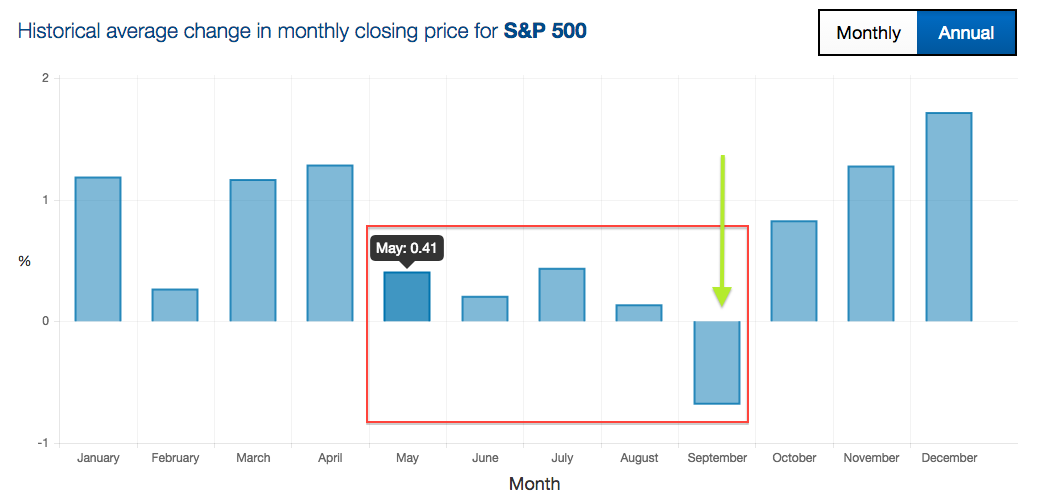
We'll start with an analysis of the monthly returns of the S&P 500, which we've done by measuring the average monthly change in closing price from 1970 to 2014. The results are shown below:
(click to enlarge)
Source: Quantified Alpha
As we can see, the S&P 500 has historically underperformed during the months from May to September (as predicted by the axiom). Five of the worst six months in the market are during this period, with none of these months averaging even a 0.5% gain. It should be mentioned that the S&P 500 still averaged a positive return during this period for every month but September, which actually averaged a monthly decline of -0.67%. This means that over the long-term, investors would still have benefited, on an absolute basis, by having their money in the market during this period - reinforcing just how important "time in the market" is versus "timing the market." Even if an investor were able to avoid the worst seasonal stretch in the market every year, the buy-and-hold investor would still have outperformed. Still, there may be better opportunities in other countries and/or other asset classes, so investors with the flexibility to make tactical asset allocations may be better off doing before May begins.
It is especially pertinent that September was the one-month with a negative average return, given that the Fed is expected to begin tightening interest rates around that time this year. With the potential of interest rate tightening, and the subsequent unease in the market, the seasonal underperformance associated with this stretch of time seems like a very realistic possibility this year. We will discuss this later in our conclusion, as it may well be an important catalyst for this thesis.
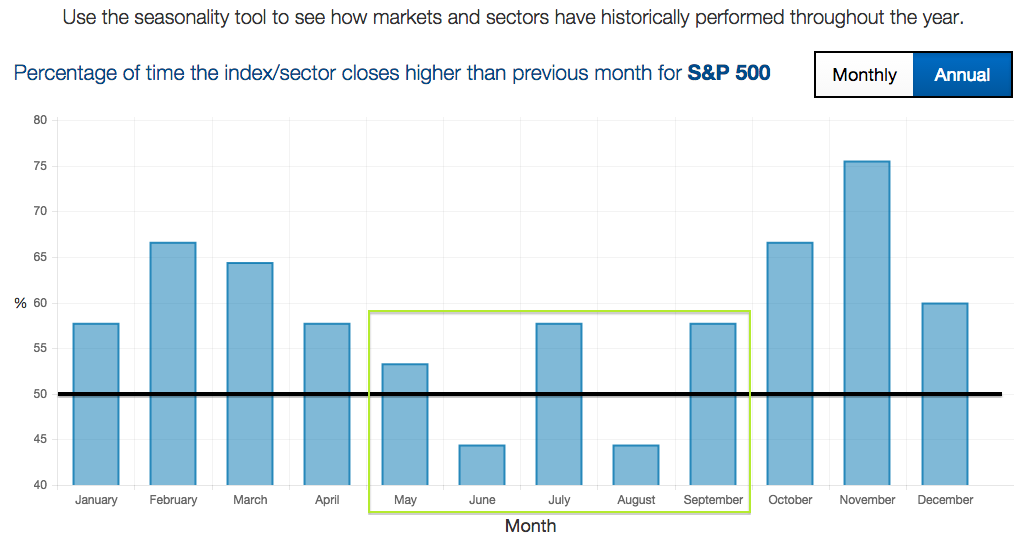
To provide more information on this seasonal trend, we've also provided the percentage of time that each month has seen a monthly gain. The table below shows the historical probability that the S&P 500 was positive for a given month, based on the years from 1970-2014:
(click to enlarge)
Source: Quantified Alpha
The three months with the lowest percentage of profitability also fall in the upcoming five-month period, again highlighting the general underperformance of this stretch. This dataset is noisy though, as July and September were positive over 55% of the time, even though the S&P 500 actually averaged a decline in September. The crash of 2008 is largely responsible for this phenomenon, as the S&P 500 lost 19% during that September. Overall, this is by no means a signal to sell/short equities, but rather a possible signal for investors to lower their expected returns from equities for the next few months as the market heads into the summer.
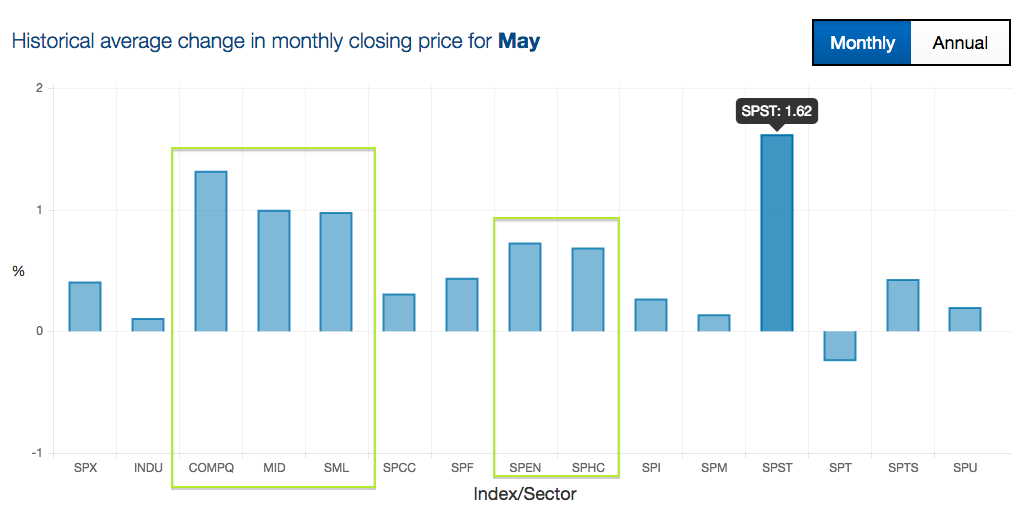
With the month of May coming up, we decided to use our seasonality tool to see which sectors and groups of equities have historically performed best during the month (measured by the average change in monthly closing price). The table below shows this performance breakdown:
(click to enlarge)
Source: Quantified Alpha
The S&P 500 consumer staples index (SPST) has performed best during the month of May, posting an average gain of 1.62% in the month. The energy (SPEN) and health care (SPHC) indexes were the next best performing sectors, both averaging a gain just below 1%. While large caps (SPX) posted a mediocre performance in May, both the S&P 400 Midcap (MID) and S&P 600 Small cap (SML) indexes posted average gains above 1%. The Nasdaq composite also averaged a strong gain (1.2%) in May, despite the fact that the S&P Technology index (SPT) averaged a loss in the month.
As we said at the start of the article, seasonality trends should not be the deciding factor in an investment decision, as we don't feel that seasonal trends are a compelling enough reason on their own. With that being said, investors would be wise to learn from market history and lower their expectations for returns in the summer. This is especially so, given that the first set of interest rate tightening is expected to come over the next few months.
We personally don't believe that the Fed will be raising interest rates until long after the analyst consensus of September. It's key to remember that most FED hawks have been consistently wrong the last few years in their predictions, and we expect that trend to continue. Given the weak economic data for March (only 126,000 jobs added, Q1 GDP growth revised down to 0% by the Atlanta Fed) and the dovish character of the Fed chief, we personally don't expect interest rate tightening for a while longer, perhaps even as late as early 2016.
This is not to say that we agree with delaying interest rate normalization, as their delay could very well lead to increased financial instability. It's just that the Fed is unlikely to be forced into raising interest rates anytime soon with inflation firmly below 1% and a stagnant labor market.
0 comments:
Publicar un comentario