By
Apr. 11, 2015 9:10 PM ET

Summary
- Despite a rally this week, the broad market remains on edge and any downside in equity markets is likely to spur safe haven demand for gold.
- Treasury bond performance has mirrored that of gold recently, showing that after a period in the wilderness gold is once again used as a hedge against equity market volatility.
- The gold chart pattern is set up very bullishly, and should the pattern play out we will likely see a $50 move to the upside in the near term.
Bulls should be happy this week as that pattern played out rather well. We gapped up on Sunday night and completed the initial move higher at just under $1225, fell back to $1193 by Thursday, and then began what may turn out to be the start of our next leg higher on Friday.
Moving forward to this week a breakout above $1225 would signify that the rally is in effect, but more than the chart pattern itself there are some fundamental reasons why I believe this rally will play out.
Are equity markets weak or strong?
I have said it often enough in the past, but when equity markets are weak investors often turn to safe haven type securities like treasuries (NYSEARCA:TLT), the volatility index (NYSEARCA:VIXY), and gold (NYSEARCA:GLD).
I wrote an article a few weeks back stating that although we may head a touch higher I thought the markets (NYSEARCA:SPY) would turn lower short term, and investors should be wary of a correction that may unfold. Well we declined over 4% from the date that was written, but given we have now rallied back up to test the highs again, a fair question would be to ask whether my outlook has changed.
My answer to that question is no -- we have so far not made any new highs since that forecast was made, and my expectation has not changed. I still perceive the greater risk to be to the downside in broad equity markets, and regardless of whether or not we do head slightly higher, I believe we are on the cusp of a decline and I'll be writing in more detail on broad equities in a separate article this weekend.
Despite weaker economic reports many Fed board members have stated that they still see a rate increase as likely this year, something the broad market is definitely sensitive to. Although the market seems to be pricing in a delay to that action, the next major report that shows improvement is likely to result in volatility. Couple that with company earnings that are expected to be relatively poor, and we have the recipe for a correction on the horizon.
More often than not, when the US market moves lower US Treasuries are bought as protection. This can be seen quite clearly in their respective charts, which show Treasuries peaking at the same time a low is formed in the S&P500 index.
Gold on the other hand has not received the same amount of "safe haven love" as Treasuries in the last few years, but are these relationships changing? Over the last 6 months gold has been purchased at roughly the same rate and time as TLT, something that is clearly evident when we compare their price patterns. Here we can see that their respective ups and downs are mirrored to more or less the same extent:
(click to enlarge)
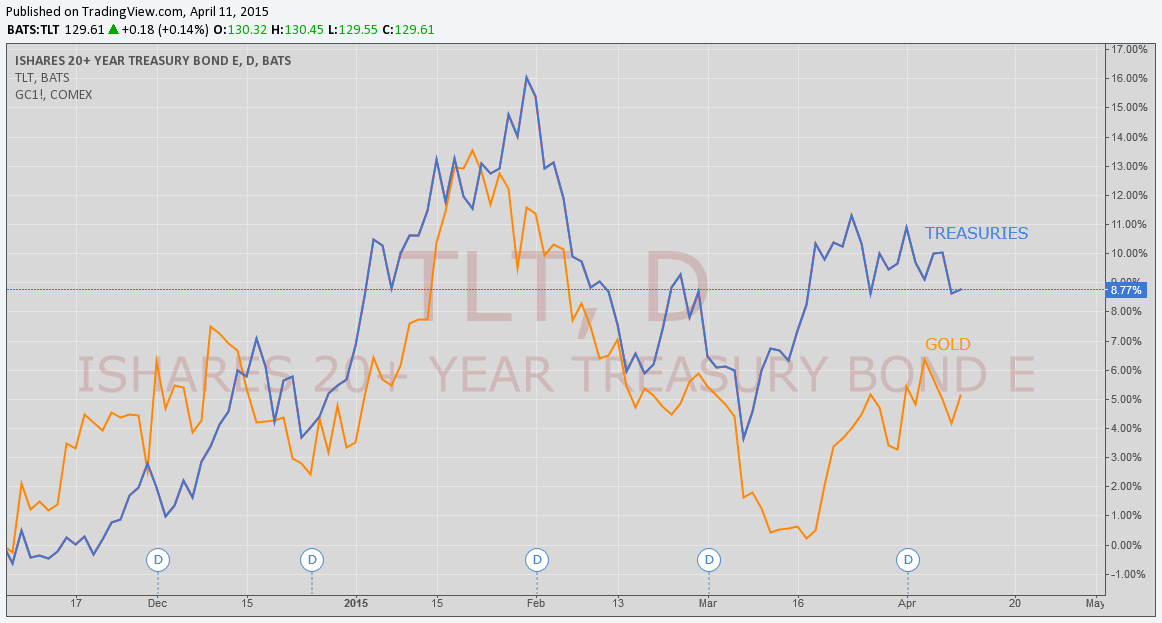
Should we see some equity market weakness over the next couple of months, we are likely to see investors turn to treasuries and gold in equal measure. A lot depends on economic numbers and investor reaction to company earnings, and given the way both gold and TLT are currently set up, we can see that this is perhaps already being anticipated by the street. Both charts are in bullish posture, and both are good candidates for gains over the next month or two.
The important thing to note is that while treasuries were the safe haven asset of choice for investors seeking shelter from equity market weakness, the tide seems to be shifting in favor of precious metals and placing them on equal footing for the time being. This is an aspect of investor behavior we want to see continue, as for a sustained rally in gold prices to occur it needs to have the kind of investor appeal the bond market has commanded in recent years.
While the market may be pricing in a delay to a rate increase, it would appear investors remain cautious on equities and are anticipating weakness ahead. As it is, the S&P500 is up just 2.7% on the year to date and investor confidence is perhaps not as high as the sentiment indices reflect, given the poor relative performance in what is traditionally a strong part of the year.
Hedge Funds Are Heavily Short Gold
Have a look at the chart below taken from the Bloomberg terminal, which shows that hedge funds are currently as short as they have ever been in the last 6 years:
(click to enlarge)
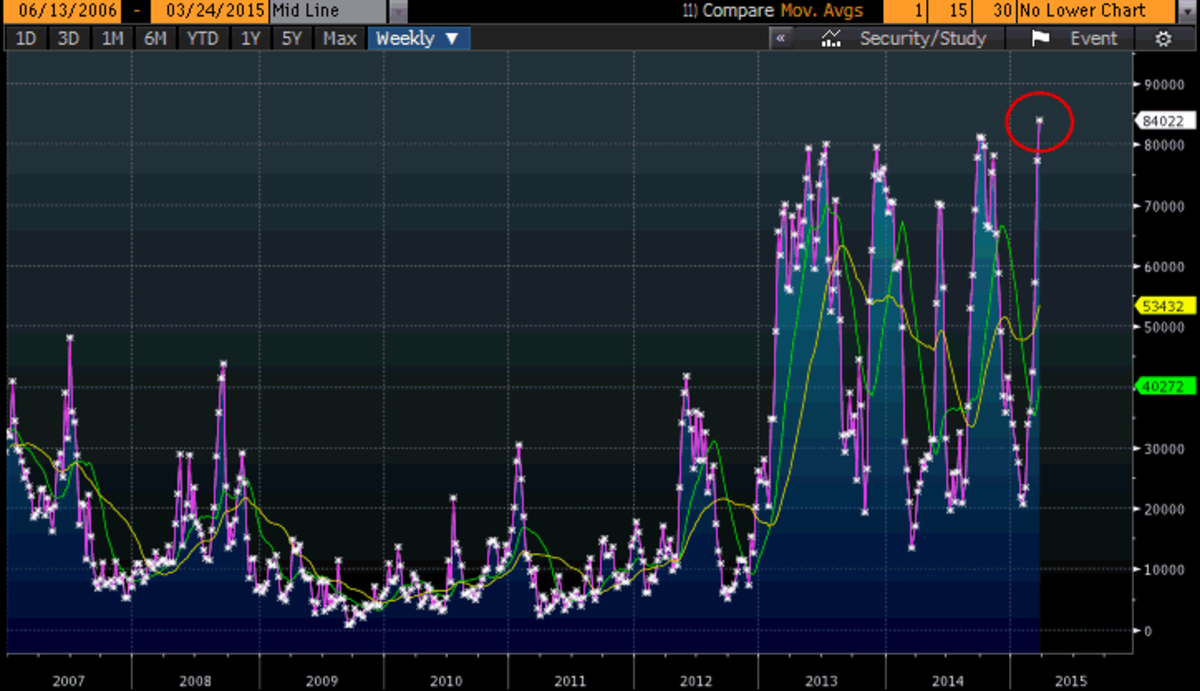
You may want to note the dates of the last time their short positions were at this kind of extreme level and the result -- these were all dates where lows formed in the gold price and rallies ensued:
| Date | % Hedge Fund Short | Result |
| June/July 2013 | 80% | 21% rally |
| December 2013 | 80% | 18% rally |
| June 2014 | 70% | 9% rally |
| November 2014 | 80% | 15% rally |
| April 2015 | 84% | ???? |
We can see then that the hedge funds are not always rewarded when they all run to the front of the bus to steer it; in fact, more often than not, the bus tips over and stops moving in their requested direction.
If you are currently short gold, a natural place to set your stop would be just above the last high, i.e., $1225, and should the price rise above that level we are more than likely going to see a fast spike higher as shorts rush to cover their positions.
Data Points
COT
As usual, let's start with the commitment of traders report -- the latest figures are below:
| COMMERCIAL | LARGE SPEC | SMALL SPEC | |||
| LONG | SHORT | LONG | SHORT | LONG | SHORT |
| 133,199 | 241,488 | 183,130 | 82,373 | 35,083 | 27,551 |
| CHANGE | CHANGE | CHANGE | CHANGE | CHANGE | CHANGE |
| -10,998 | +16,176 | +10,312 | -10,426 | +2,085 | -4,351 |
At first glance you may be a little disappointed with the figures, as it shows that the commercial category have added to their short positions and reduced the number of their long contracts.
This is a little misleading, however, as it is the ratio of long to short positions that we are interested in.
Sometimes it is easier to see a visual representation, so I have included a chart of the commercial positioning overlaid with the gold price to show what happens when the ratio hits certain levels (chart courtesy of TDF Ameritrade & iSPYETF):
(click to enlarge)
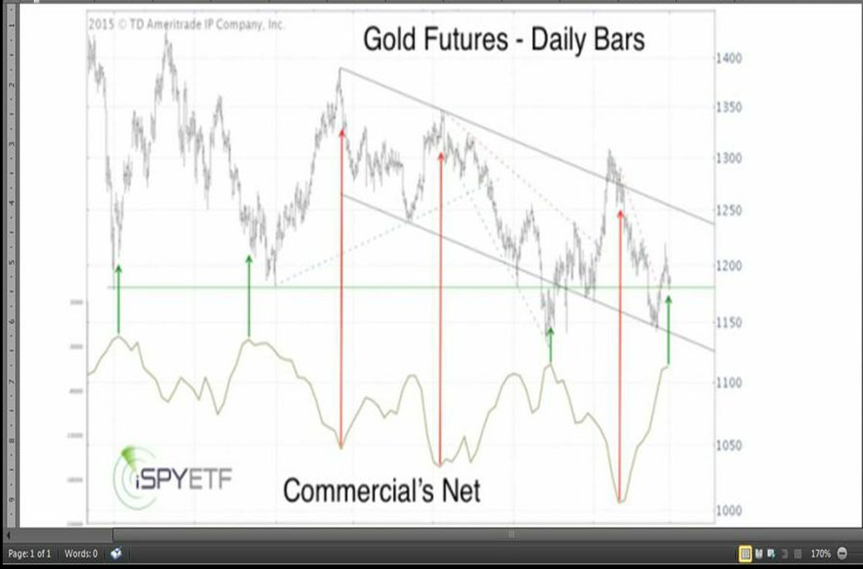
Reviewing the figures, the actual numbers of contracts owned by the commercials is eerily similar to those held when I wrote my first article in mid-December 2014, just before gold rallied from $1180 to $1308 by late January.
If we do indeed see a rally in the short term you can expect to see the commercials add to their short positions, while the large and small speculator categories chase price by adding to their long positions the higher we go.
GOFO
As of last week backwardation remained in place, although at relatively slight levels and perhaps not at levels that result in a consistent bid underneath gold prices. This does not necessarily concern me as I believe there to be a weight of evidence in place to support a rally, and I expect backwardation to subside over the coming month.
US Dollar
Although the dollar (NYSEARCA:UUP) rallied hard towards the end of last week, I am not so certain that the correction is over and we will make new highs from here. I would expect further consolidation into the summer before the next leg higher, but you should note that it is perfectly possible to test the highs before we test the lows.
Regardless, you should note gold rallied with the dollar on Friday and this can certainly be added to the growing number of factors that support an impending rally. Resistance for the DXY Dollar Index chart remains at 100 and 103, with support standing at 94 & 92.
Miners
The miners performed well last week and it was noticeable that they failed to decline to any real extreme even when gold fell from $1225 to $1193. The charts I provided in last week's article still apply with the same support and resistance levels in place for the Majors (NYSEARCA:GDX) and the Juniors (NYSEARCA:GDXJ).
GOLD CHART
The gold chart pattern is currently about as short-term bullish as it gets. Of course, patterns don't always play out as expected, but the set-up is there all the same. The latest chart is below:
(click to enlarge)
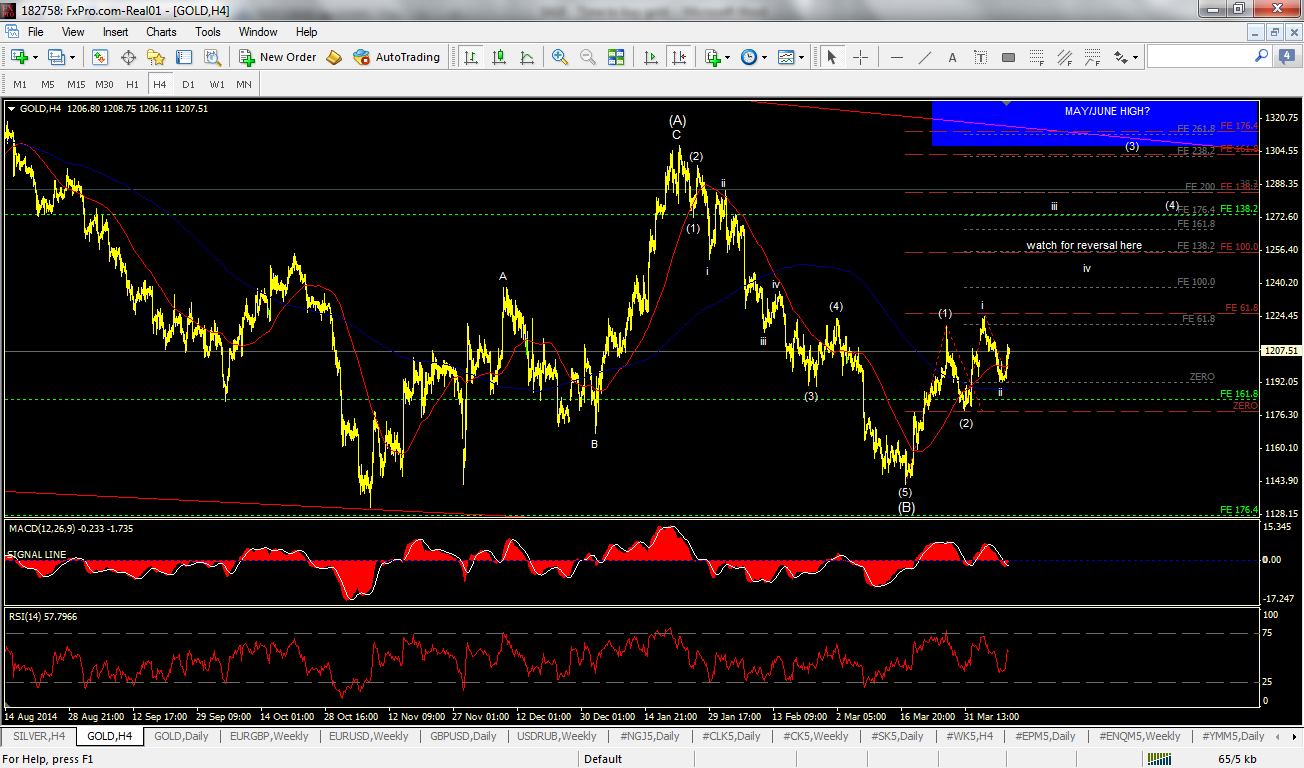
In the most bullish count we should now not break the $1193 low on any retrace, and the short-term target for the next move higher is $1275. This would be the strongest and quickest part of the rally should this pattern play out.
The overall target is between $1330 and $1380 for completion of our wave C. Once wave C completes, I expect a decline to new lows in gold.
If we do decline through $1193 in the short term (not my primary expectation), we have support just below at $1172 and $1163, and we could still maintain bullish posture and rally from those levels.
Declining through $1163 would be bearish overall and the count would need to be revised.
0 comments:
Publicar un comentario