This Stock Market Bubble Will Burst Like An Overinflated Balloon
Mar. 26, 2015 3:52 AM ET
Summary
- The stock market is clearly in bubble territory right now, and like all bubbles in history, it will eventually burst.
- Investor bullishness is near record highs, which is a good indication that the six-year bull market is nearing its end.
- Once the inevitable and unpredictable crash does occur, it will put further strain on the increasingly fragile U.S. economy.
- Equity tail-hedging will allow investors to profitably ride the roller coaster of ups and downs of the market.
The latest bubble has formed in the U.S. stock market, which has been soaring for several years now. Investor bullishness is quickly approaching record levels, even as stock valuations move into territory not seen since the frenzy of the internet bubble 15 years ago. Of course, this bullishness is nothing more than a giant confidence game based on the Fed's easy money policies: the instant investors lose confidence there will be a severe crash. In this article, we'll see just how overinflated this bubble has become and discuss what you can do to protect yourself against its inevitable destruction.
One of the Largest Stock Market Bubbles Ever
The S&P 500 (the proxy index for the U.S. stock market) has been on a massive winning streak, rising over 200% since it bottomed out in early March 2009, making this the fourth-longest bull market in history. But these six straight years of gains have caused stocks to be bid up to unsustainable price levels - creating a huge bubble that will lead to an eventual stock market crash.
For instance, the Shiller P/E ratio currently sits at ~28x, which is how high it got at the peak of the 2007 real estate bubble. That's more than 65% above the historic average of 16.6x. The only times in history that the market has been more overvalued was during the bubbles of 1929 and 1999.
Exhibit 1: Shiller P/E Ratio is More Than 65% Above Historical Norms
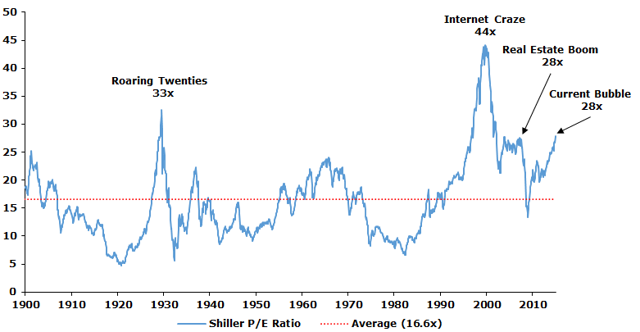
Note: The Shiller P/E/ ratio avoids the problems of volatile earnings in the P/E ratio by averaging the inflation adjusted earnings of the last 10 years.
Source: A North Investments, S&P Dow Jones Indices, Robert Shiller
Valuations look even worse when we consider the fact that corporate profit margins are near all-time highs, which actually makes the Shiller P/E ratio lower than it should be. Corporate profits have climbed to nearly 11% of GDP, while their historical average is only 6.5%. That's a pretty wide gap!
But since above average profits tends to attract new competitors - that's how capitalism works, after all - profit margins have a strong tendency to mean-revert in the long run (and when that happens, stock prices get hit hard). In fact, when making adjustments for historic profit margin differentials, the market today has roughly the same Shiller P/E ratio that it had during the internet bubble back in 1999 (which was the largest stock market bubble in history).
Exhibit 2: Corporate After-Tax Profit Margins are at Record Highs
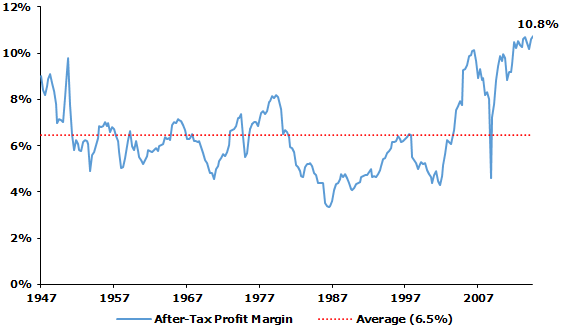
Note: Raw data for U.S. corporate after-tax profits only dates back to 1947.
Source: A North Investments, Federal Reserve Bank of St. Louis
A
nother great long-term valuation indicator is the ratio of total stock market capitalization to GDP (usually called the "Buffett Indicator"). Warren Buffett has often said that this is probably the best measure of where valuations stand at any given moment because it compares the relationship between the stock market and the economy. In short, any time this ratio rises significantly above its long-term average of about 72%, the stock market is dangerously overvalued and vulnerable to crashes. Today this metric stands at roughly 122%, which means stocks are now even more overvalued than they were at the peak of 2007 real estate bubble - a frightening fact, to say the least.
Exhibit 3: Buffett Indicator is at the Second Highest Level Ever
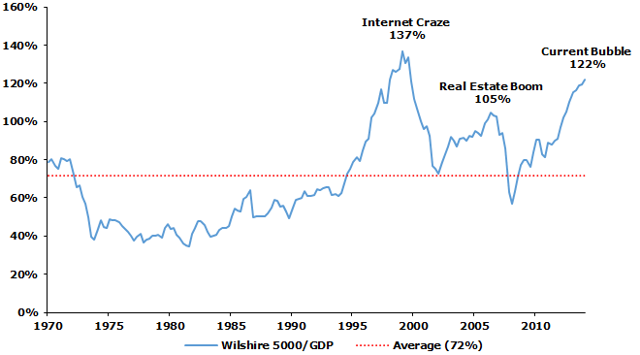
Note: (1) The Wilshire 5000 is the best proxy for the stock market because it includes almost all publicly traded U.S. based companies. (2) Raw data for the Wilshire 5000 only dates back to 1970.
Source: A North Investments, Federal Reserve Bank of St. Louis
Increasingly Fragile U.S. Economy
The current bull market was (and still is) driven by the Fed's ultra-low interest rate policies after the Great Recession, which forced investors to seek higher returns in stocks. Ironically, this desperate attempt to help revive the U.S. economy has caused stocks, as I showed above, to be bid up to fundamentally-absurd price levels - creating a huge bubble which will inevitably burst, most likely leading to another severe recession.
Of course, recessions are perfectly normal - they're part of the natural economic cycle. But the keyword here is "natural," and what our economic policymakers are doing is anything but natural. Their artificial manipulation of the economic cycle (especially attempts to prevent recessions) tends to, at best, prolong the "boom" and make the subsequent "bust" much worse.
This is because absence of natural fluctuations in the economy causes hidden risks to accumulate (e.g., too much debt) and becomes a catalyst for disaster. In fact, the longer it takes for a blowup to occur, the worse the resulting damage will be. It's a lot like the old practice of preventing small forest fires from taking place; it allows flammable material to build up so that when a fire does happen, it's catastrophically big.
So while, on the face of it, the U.S. appears to be doing quite well right now, it's nothing more than a temporary illusion - the calm right before the storm. Things looked great back in January 2007 as well - the economy was growing, unemployment was low, and inflation was under control. That's as good as it gets economically, but like in 1929, appearances were deceptive. By December of that year, the country officially entered a terrible recession, which nearly crippled the entire global financial system.
The scary fact is that the U.S. is now even more economically fragile than it was eight years ago, making it significantly more vulnerable to future crises. The country has racked up more debt than ever before - over $18 trillion and growing by the second, which doesn't even include the tens of trillions in off-balance sheet obligations related to Medicare, Social Security, and other entitlements.
Moreover, the same mega-banks responsible for the financial meltdown have become even larger, rendering them now "too-bigger-to-fail" than before. The assets of the five largest banks in the country (not including their trillions in off-balance sheet assets) have grown from 43% of GDP before the financial crisis to 51% of GDP at the end of 2014 through a combination of bailouts, mergers, and takeovers.
Given all of this, it's only a matter of time before this increasing economic fragility reaches a breaking point and collapses, bursting the overinflated stock market bubble and plunging the U.S. into another deep recession or, even worse, a depression. And at the rate things are going, the country will eventually dig itself into a hole that it can't climb out of. A Roman Empire-style collapse is not merely a possibility, it's a virtual certainty!
Crashes Happen When We Least Expect Them
There's an old saying that if something can't go on forever, it won't. Likewise, if a stock market bubble can't expand forever, it won't; one day it will burst (although predicting when that day will come is impossible). Given this fundamental truth, you'd expect "rational" investors to be increasingly bearish and risk-averse as the stock market soars to record highs, since it increases the likelihood of an eventual crash. However, the exact opposite seems to be the case - they're becoming increasingly bullish and risk-seeking.
Below is a chart of the S&P 500 versus the CBOE's Volatility Index ("VIX"), also known as the "fear index." Derived from S&P 500 option prices, the VIX is a measure of investors' expectations for stock market volatility over the next 30 days. As a general rule, the higher the VIX, the higher the fear; conversely, the lower the VIX, the lower the fear, which indicates a complacent market. As shown below, the S&P 500 is at an all-time high, while the VIX is near all-time lows. This suggests that investors foolishly expect the good times to continue.
Exhibit 4: VIX is Near Multi-Year Lows Indicating a Complacent Market
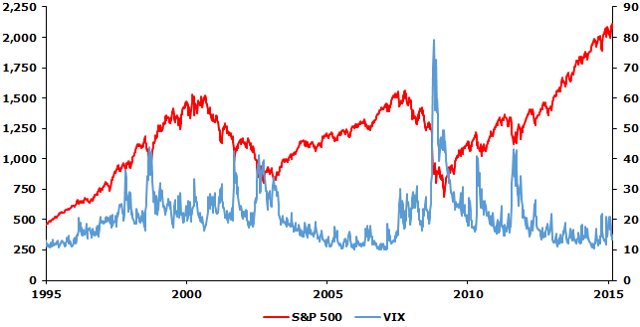
Source: A North Investments, Chicago Board Options Exchange ("CBOE")
But the more bullish investors become (i.e., the lower the VIX gets), the higher the likelihood that a crash is just around the corner. This is exactly what happened after the VIX hit an all-time low in February of 2007. Just like today, the stock market was soaring at the time, but then - right when investors' confidence that the bull market would continue was at its peak - everything collapsed like a house of cards on a windy day. And just like the poor, ignorant turkey who wakes up Thanksgiving morning expecting lunch as usual - millions of investors were completely caught off guard when the crash occurred, suffering enormous losses as a result. The moral: Don't be an investing turkey!
Profiting From the Inevitable Crash
The inescapable fact is that sooner or later, the stock market boom must end. Of course, it's impossible to know when precisely this will occur - could be tomorrow or five years from now.
Given this uncertainty, we always have to be prepared for the worst case scenario because, given enough time, it will eventually become a reality. That's why it's important to always have some kind of insurance policy in place to insulate ourselves from unexpected market downturns and, ideally, even profit from them.
One way to accomplish this is to have a sizable amount of "dry powder," or uninvested cash, on hand. The optionality of cash allows you to take advantage of temporary market inefficiencies in order to earn outsized long-term returns. In a now famous example, back during the dark days of 2008 when most companies were strapped for cash, Warren Buffett made some of the best investments of his career acting as a lender of last resort to companies such as Goldman Sachs (NYSE:GS) and General Electric (NYSE:GE). Cash-rich Buffett wouldn't have been able to do those lucrative deals had he been fully invested, and it would have certainly hurt his track record.
However, a large drawback to sitting on cash is that it can take a very long time for attractive investment opportunities to arise (as we've seen during the current bull market, stocks can remain overvalued for years). Moreover, given that 95% of market gains have historically occurred on just 1% of the trading days, an investor who frequently carries a large cash position is very likely to miss most of these significant gains. So, instead of guessing (usually incorrectly) the best times to be in or out of the market, we'd be better off using something called "equity tail-hedging." It essentially allows us to capture the upside of bull markets while limiting the downside risk when markets are falling. Although there are many different ways to construct an equity tail-hedged portfolio, the one I'm about to describe is one of the simplest and most effective.
The way it works is as follows: you allocate 98% to 99% of your annual assets into an ETF (or index fund) that tracks the S&P 500 index. Something like the Spider S&P 500 (NYSEARCA:SPY) is an excellent choice in this case. The remaining 1% to 2% is used to purchase far out-of-the-money put options on that same ETF, which are continuously rolled into new contracts as they approach expiration. The puts will rise in value when the market crashes, and these hedging profits are then reinvested back into the undervalued ETF whose subsequent returns will be much higher.
The beauty of the equity tail-hedging strategy is that it allows us to profitably ride the roller coaster of ups and downs of bull and bear markets. There's no economic forecasting or market timing required (which is a huge waste of time anyway). So, regardless of whether the current bull market bubble continues expanding or whether it bursts - this portfolio strategy is guaranteed to earn attractive long-term risk-adjusted returns.
Summary and Conclusión
The stock market is clearly in bubble territory right now, and like all bubbles in history, it will eventually burst. And this could happen sooner rather than later given that investor bullishness - a classic contrarian indicator - is near record levels right now. One of the best ways to profit from this inherent market uncertainty is to employ equity tail-hedging. This simple strategy allows us to capture the upside of bull markets while also providing downside protection against unexpected market declines. Thus, regardless of which direction the market moves, this portfolio strategy is guaranteed to earn attractive long-term risk-adjusted returns.
0 comments:
Publicar un comentario