What Are The Odds We're Heading For Another Crash?
Ben Carlson's Tumblr
13.10.14
Many investors have been hoping for a “healthy” correction to put money to work at lower prices, but corrections never feel healthy when they finally hit.
It always feels like this is the big one when losses start to pile up. We start hearing comparisons to the prior peaks in 2000 and 2007 along with some scary stories about the 1987 crash.
Investors are now conditioned to expect binary outcomes in the markets. It’s either a top and we’re heading for a crash or it’s a bottom and markets are goig straight up. Either of these scenarios is always a possibility, but rarely are the markets at an inflection point. There’s usually more of an ebb and flow than most investors realize.
In his terrific video called How the Economic Machine Works, Ray Dalio explains how the credit cycle works in general terms. Dalio offers an example using a simplified version of the relationship between credit growth and growth in the economy and how it fluctuates around productivity growth:
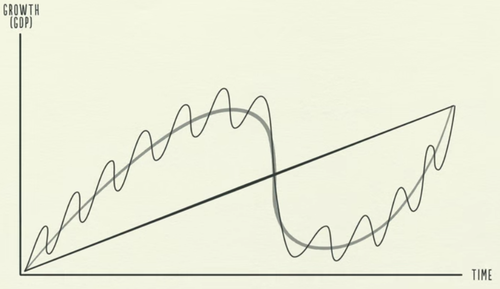
When the good times start to roll we see too much debt in the system and things can get out of control, which is exactly what happened leading up to the great financial crisis. Following the euphoric build-up, there’s a readjustment period where we undershoot potential productivity in the economy (sound familiar?).
Within this long-term secular cycle are much shorter cyclical periods:
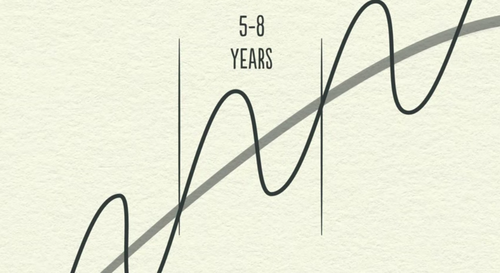
With two huge market declines in a the same decade, investors are constantly on edge waiting for the next crash. The scars are still fresh. But we’re more likely to see cyclical, not secular, market drops for the simple fact that they happen more often.
Let’s assume the S&P 500 ends up falling 10% or more, something that hasn’t happened since 2011. I don’t know if this will happen, but it’s not out of the realm of possibilities. Does this mean we’re heading for another 50% crash? Maybe, but probably not. That magnitude of loss is fairly rare historically.
I looked at the S&P 500 data going back to 1950 and found that there have been nearly 30 instances when stocks fell by 10% or more, roughly once every two years (go back to 1928 and it happens around once a year).
In that time stocks have only fallen 30% or more five times. It happens, but it’s rare. That’s one out of every thirteen years. Here are the rest of the stats on the double digit losses:
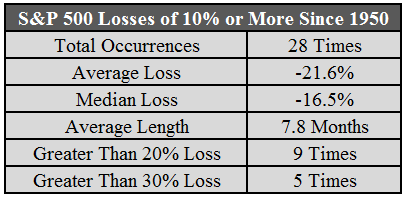
You can see the average double digit loss lasted almost 8 months and led to a bear market. The huge losses are the exception, not the rule. Two-thirds of the time, when the market falls by double digits, it’s down by less than 20%. About half the time it’s down less than 15%.
These numbers don’t make you feel any better when you see the value of your portfolio drop, but it’s puts things into perspective. There are no rules set in stone in the financial markets and there’s no playbook that tells you ahead of time that this type of market will only lead to a 10-12% decline but that one will lead to a 30%+ crash.
Of course, these aren’t actual odds. It’s just what’s happened historically. Anything can happen. There are always outlier events that could strike and upset market dynamics to cause a crash. No one really knows.
But you can’t plan on a stock market crash every single time stocks fall. Sometimes stocks go down without an enormous crash. Were it not for the occasional correction or bear market stocks wouldn’t offer a risk premium over bonds and cash.
Plan on seeing stocks fall plenty of times over your lifetime, including the occasional crash.
0 comments:
Publicar un comentario