What It Really Costs To Mine Gold: The Kinross Gold Second Quarter Edition
Aug. 21, 2014 6:32 AM ET
by: Hebba Investments

Summary
- Kinross’s costs on both a core and a core non-tax basis have continued to fall significantly on a year-over year basis.
- Sequentially though the second quarter saw Kinross's cost rise from the surprisingly good first quarter numbers.
- While Kinross's silver production was down due to the closure of La Coipa operations, gold production has been rising.
- Investors should also monitor the company's ability to service its debt as at current gold prices it is essentially breaking even.
Introduction
In our previous complete Q3FY13 cost analysis, we went over a number of the industry's all-in costs to mine an ounce of gold in 2013 and discussed one of the most important metrics to analyze the gold industry, the actual cost of mining an ounce of gold, which can help an investor figure out whether it is time to buy GLD and/or the gold miners. In that analysis, we used the 2013 financials to calculate the combined results of publicly traded gold companies and come up with a true all-in industry average cost of production to mine each ounce of gold.
In this analysis we will calculate the real costs of production of Kinross Gold (NYSE:KGC), a mid-tier producer of gold and silver with operations that span the globe. They have operating mines in North America, South America, West Africa, and Russia.
How to Use Our All-in Costs Analysis with Your Investments
In the previously mentioned article, we gave a thorough overview of the current way that mining companies report their costs of production and why it is inaccurate and significantly underestimates total costs. Then we presented a more accurate methodology for investors to use to calculate the true costs of mining gold or silver. Please refer to that article for the details explaining this methodology, which is an important concept for all precious metals investors to understand.
The best way to use this analysis for individual companies is to compare the different production cost metrics with the company's profits to look for any anomalies (e.g. large net profits but high costs). Also, we provide historic data to allow investors to check out any trends in regards to costs or production totals that may be an early warning to future successes or failures for the company. Ultimately, this analysis is best used as a first step to further investigative work, and that is our purpose with releasing this series.
Explanation of Our Metrics
For a detailed explanation of the metrics and each metric's strengths and weaknesses please check out our previous full quarterly all-in costs gold report where we discuss them in detail.
All Costs per Gold-Equivalent Ounce - These are the total costs incurred for every payable gold-equivalent ounce, which includes everything. This is the broadest measure of costs, and since it includes write-downs, it is essentially the "accounting cost" of producing gold-equivalent ounces.
Costs Per Gold-Equivalent Ounce Excluding Write-downs and S&R -This is the cost to produce each gold-equivalent ounce when subtracting write-downs and smelting and refining costs, but including everything else.
Costs Per Gold-Equivalent Ounce Excluding Write-downs - This is similar to the above-mentioned "Costs per Gold-Equivalent Ounce Excluding Write-downs and S&R" but includes smelting and refining costs. That makes this measure one of the best ways to estimate the true costs to produce each ounce of gold, since it has everything (including taxes) except for write-downs.
Costs per Gold-Equivalent Ounce Excluding Write-downs & Taxes -This measure includes all costs related to gold-equivalent production excluding all write-downs and taxes. Essentially this is the bottom dollar costs of production with an artificial 0% tax rate (obviously unsustainable) which works well because it removes any estimates of taxation due to write-downs or seasonal fluctuations in tax rates, which can be significant. The negative to this particular measure is that since it does not include taxes, it will underestimate the true costs of production.
True Costs of Production for Kinross Gold
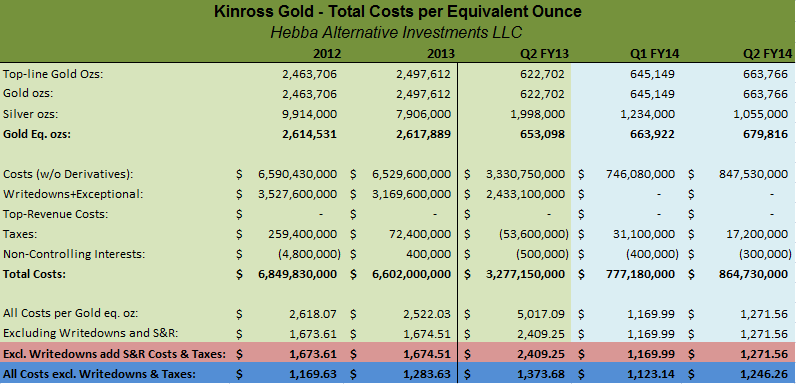
Let us use this methodology to take a look at the company's results and come up with the true cost figures for each ounce of production. When applying our methodology, we standardized the equivalent ounce conversion to use the average price for Q2FY14 which results in a silver-to-gold ratio of 65.7:1.
Since our conversions change with metal prices, this may influence the total equivalent ounces produced for past quarters - which will make current-to-past quarter comparisons much more relevant.
(click to enlarge)
Notes about All-in Costs Table
Observations for Investors
Kinross gold's production totals have been heavily influenced by write-downs over the last few years as write-downs have been more than $3 billion per fiscal year over the last two years. We're happy to see in FY2014 there have been no significant write-downs so that gives us a much better look into the company's true costs of production but it does make year-over-year comparisons much more difficult.
Core costs for Q2FY14 were $1272 per gold-equivalent ounce, which was around 10% higher than costs experienced in the first quarter ($1170 per gold-equivalent ounce), but were far better than costs experienced over the last few years - though we do stress that large write-downs significantly affect core costs so this measure isn't best for quarters with large write-downs.
As for core non-tax costs (costs excluding taxes), they also rose on a sequential basis from a surprisingly good $1123 in Q1FY14 to $1246 in the current quarter. Since its below the gold price Kinross was making money at current gold prices, but the rise in costs on an equivalent ounce basis is something investors should note.
On a comparative basis, we've only published the analysis from a few other competitors with Goldcorp GG) registering core non-tax costs of under $1050 per gold-equivalent ounce, Yamana Gold (NYSE:AUY) registering core non-tax costs of under $1200 per gold-equivalent ounce, Barrick Gold (NYSE:ABX) registering core non-tax costs of under $1300 per gold-equivalent ounce, Agnico-Eagle Mines (NYSE:AEM) registering core non-tax costs of under $1200 per gold-equivalent ounce, Alamos Gold (NYSE:AGI) registering core non-tax costs of around $1200 per gold-equivalent ounce, Allied Nevada Gold (NYSEMKT:ANV) registering core non-tax costs of over $1300 per gold-equivalent ounce, Eldorado Gold (NYSE:EGO) registering core non-tax costs of under $1000 per gold-equivalent ounce, Iamgold (NYSE:IAG) registering core non-tax costs of under $1300 per gold-equivalent ounce, Randgold (NASDAQ:GOLD) registering core non-tax costs of under $1000 per gold-equivalent ounce, and Newmont Mining (NYSE:NEM) registering core non-tax costs of under $1150 per gold-equivalent ounce. As investors can see, based on the rankings of other gold miners Kinross ranks in the middle group on a core non-tax basis.
Conclusion for Investors
The last two quarters have given us a much better picture of some of Kinross's core costs as significant write-downs have not occurred and that means core costs provide a much more accurate picture of the company's true production costs. With core costs of $1272 in the second quarter, the company is another one of the many miners treading water at the current gold price, but that isn't much different than many other gold miners.
One other thing to note is that Kinross's silver production has dropped significantly due to the closure of the company's La Coipa operations. These operations may be reopened if the company finds that the feasibility analysis is promising, but at this point we have no confirmation about any reopening of these operations.
Investors should note that even with the loss of these ounces, gold-equivalent production has risen as Kinross has been significantly increasing gold production at its existing operations and we think they are on pace to hit the higher end (or beat) existing guidance of 2.5 to 2.7 million ounces of gold-equivalent in FY2014 - that may be a positive for investors.
At current gold prices (and with companies essentially breaking even in terms of their profits), investors need to pay particularly close attention to the cash flows of miners with higher debt loads and Kinross gold is one of those miners. While cash equivalents are high at over $700 million dollars, debt is also very high at over $2 billion dollars and that is something that Kinross gold investors should be monitoring carefully because it is much easier to tread water without a large debt load. A complete credit analysis is beyond the scope of this article, but the ability of the company to maintain its debt (and hopefully pay it off) is something very important for investors to watch.
0 comments:
Publicar un comentario