How I Learned To Stop Worrying And Love The Bomb Debt And Associated QEternity
Oct 17 2013, 20:24


Dr. Strangelove's comment seems appropriate to me this day. It's always our duty to try to make money for subscribers but getting there is now an emotional challenge certainly. Logic and your education in this regard needs to be checked at your desk before you turn on your computer with the news "off." It's made harder yet since most people want to know the why of things. Well, the dissatisfying answer remains the same: "Markets are rising because… well, because they are dammit."
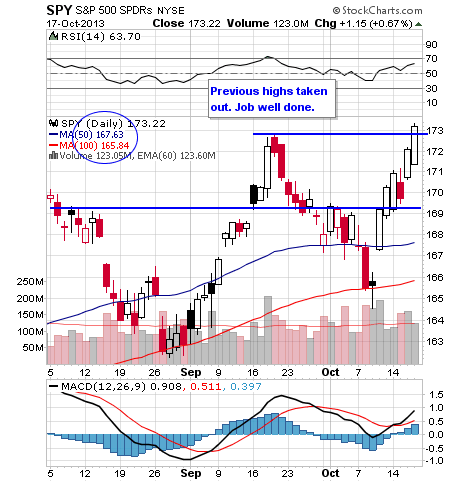
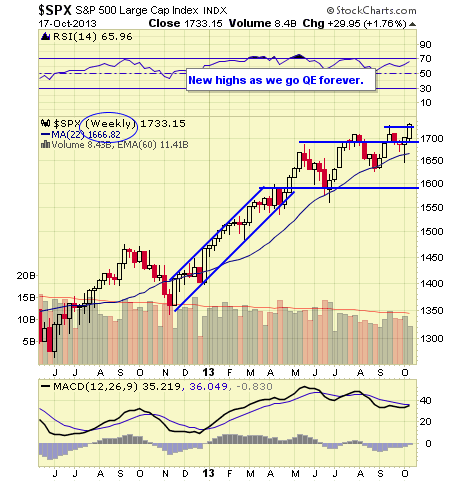
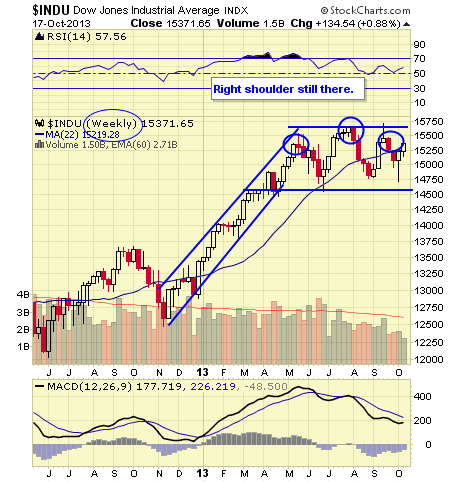
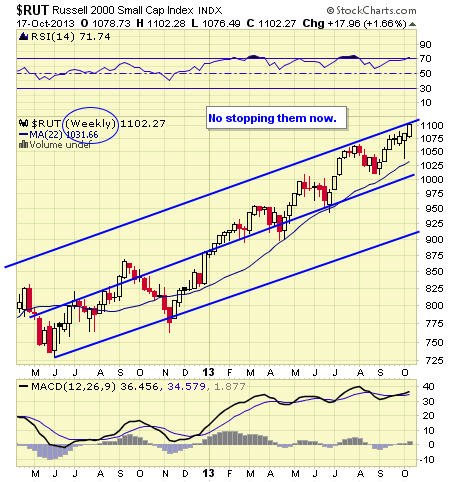
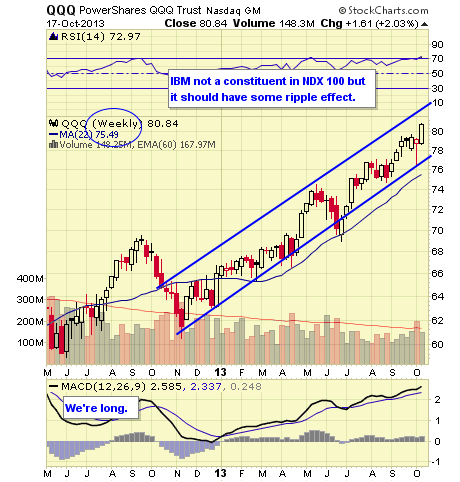
The day after the congress voted to reopen the government and go to $17 trillion in debt stocks rallied sharply, especially away from the Dow Jones Index, which we'll discuss in a moment. New highs were seen in the S&P 500 (SPY), Small Caps (IWM), Tech (QQQ), Bonds (TLT), REITs (VNQ), Financials (XLF) and even (GLD) since the dollar (UUP) fell sharply.
Some of the news starting to dribble out after the deal was reached was a nice little $2 billion freebie for Mitch McConnell and HR 2775 where by the Treasury Department is authorized to suspend the debt ceiling. In other words, No Limit to government borrowing. As for McConnell's pay-off, there surely are many others who got their pocket lined.
As most investors know, the Dow Jones Industrial Average is a price-weighted index. This means International Business Machines (IBM) has had the heaviest influence by far in the performance of the index over the past couple of years. We saw much the same situation with Apple (AAPL), which had heavy weightings to many tech indexes as well. When those two companies were doing well the indexes did well and vice versa as those stocks fell. When IBM was over $215 per share, the Dow Jones Index was disproportionately pushed higher. But things turned around recently and then fell precipitously Thursday to $173 on earnings news, which took the index lower. The same situation happened to tech indexes when Apple's price soared to over $700 over a year ago only to see the price fall to just under $400 in June driving many Apple-weighted tech indexes lower.
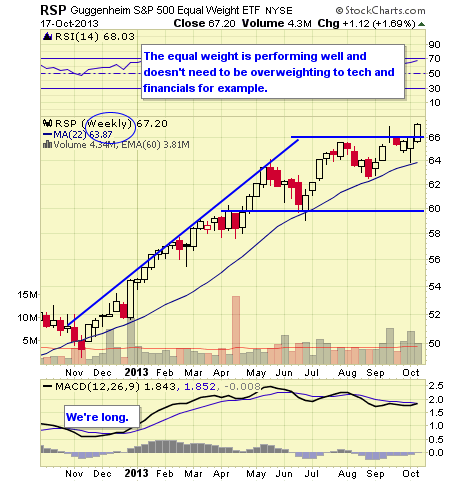
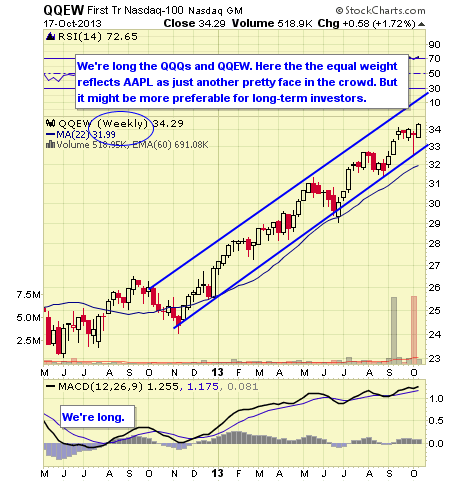
For those wanting long-term exposure using equal-weight ETFs is the best way to go. For tech First Trust NASDAQ 100 ETF (QQEW) keeps you exposed to tech but not pushed around so much by just a handful of stocks. There is no equal-weight Dow Jones Index but there is for the S&P 500, Guggenheim Equal Weight S&P 500 ETF (RSP). We utilize both of these ETFs in our core growth portfolios.
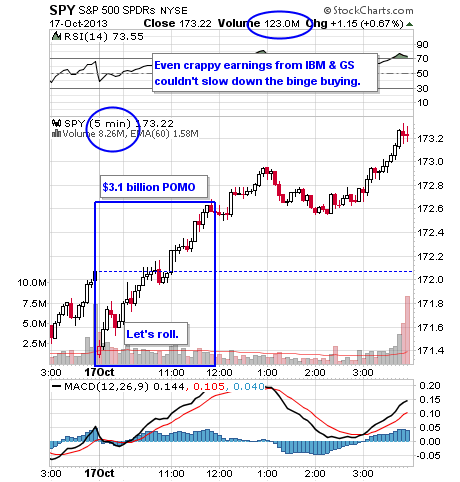
There was a trickle of economic data Thursday. Jobless Claims were 358K vs 330K expected, and prior 373K. That was rather funny since California data is still for the most part FUBAR. The Philly Fed Survey was 19.8 vs. 15 expected and prior 22.3. Basically you can't trust any data you see at this time whether from the U.S. or abroad. Earnings from Goldman Sachs (GS) were disappointing even with those always trusty "ex-factors," you know those earnings ex-adjusted for this and that item.
Volume was modest but even crummy earnings from two bellwethers couldn't slow bulls down. Breadth per the WSJ was positive.
I guess now we know that it's up to the Fed to keep printing money until that policy is rejected by markets. Until then bulls will keep bidding stocks higher since the Fed has given them no other choice or sector to invest in. It's really that simple.It isn't a joke to say this is all quite new. All the education and experience you bring to the table after 40 years of business experience is now rendered useless from a fundamental view. The real deal is just to follow the tape no matter what's driving it higher.
Let's see what happens.
(click to enlarge)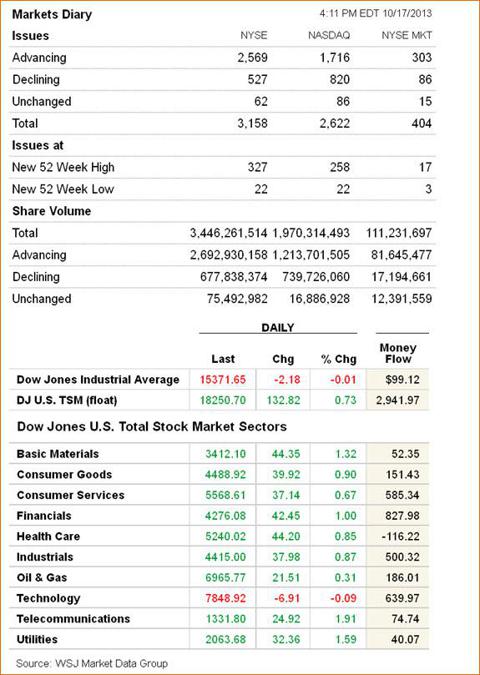

(click to enlarge)
- NYMO
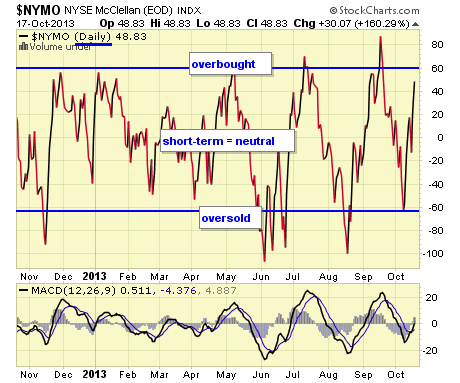 The NYMO is a market breadth indicator that is based on the difference between the number of advancing and declining issues on the NYSE. When readings are +60/-60 markets are extended short-term.
 - NYSI
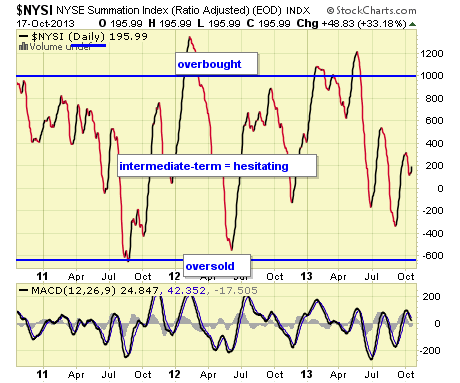 The McClellan Summation Index is a long-term version of the McClellan Oscillator. It is a market breadth indicator, and interpretation is similar to that of the McClellan Oscillator, except that it is more suited to major trends. I believe readings of +1000/-1000 reveal markets as much extended.
 - VIX
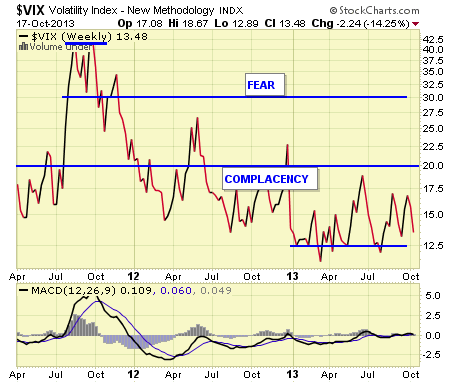 The VIX is a widely used measure of market risk and is often referred to as the "investor fear gauge." Our own interpretation is highlighted in the chart above. The VIX measures the level of put option activity over a 30-day period. Greater buying of put options (protection) causes the index to rise.
 - SPY 5 MINUTE
- SPY DAILY
- .SPX WEEKLY
- INDU WEEKLY
- RUT WEEKLY
- QQQ WEEKLY
- RSP WEEKLY
- QQEW WEEKLY
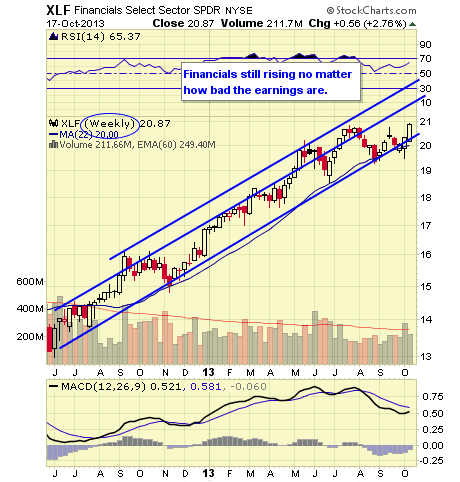
- XLF WEEKLY
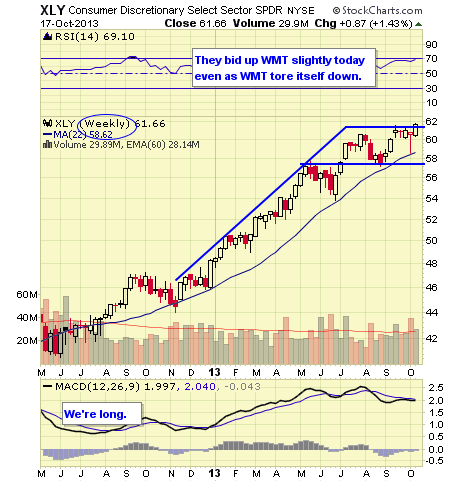
- XLY WEEKLY
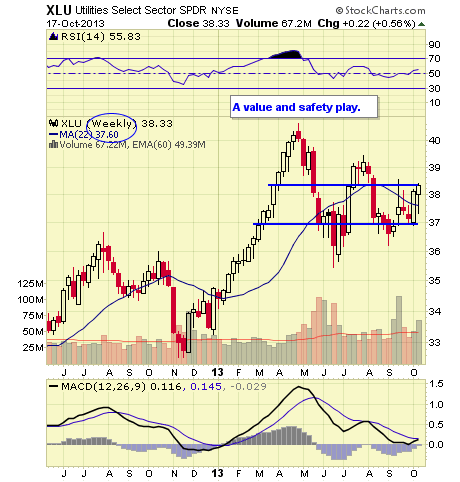
- XLU WEEKLY
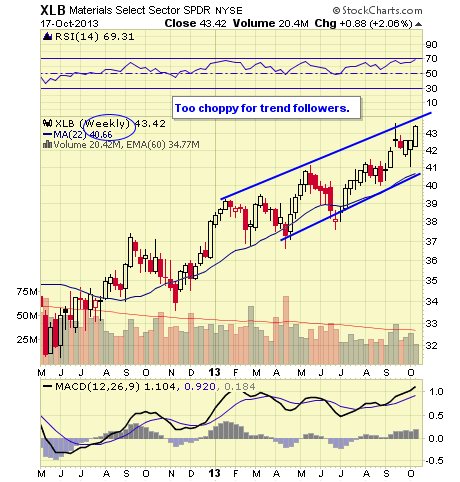
- XLB WEEKLY
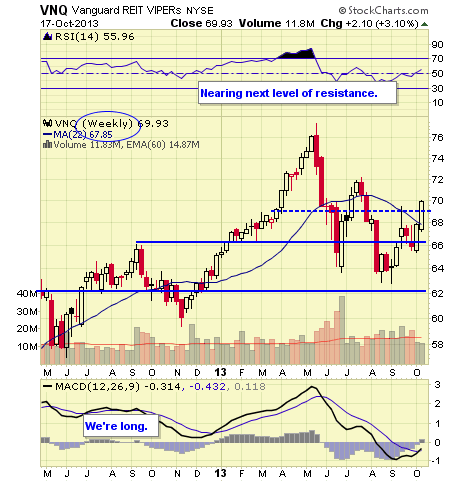
- VNQ WEEKLY
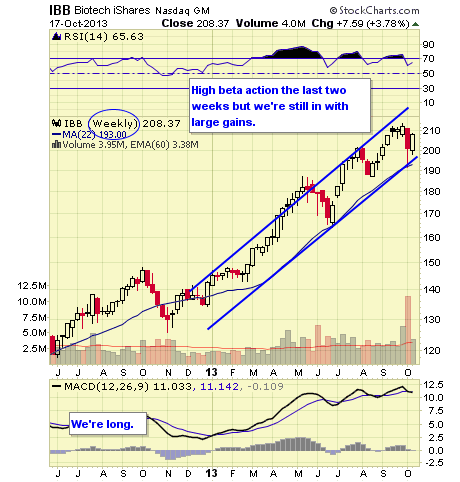
- IBB WEEKLY
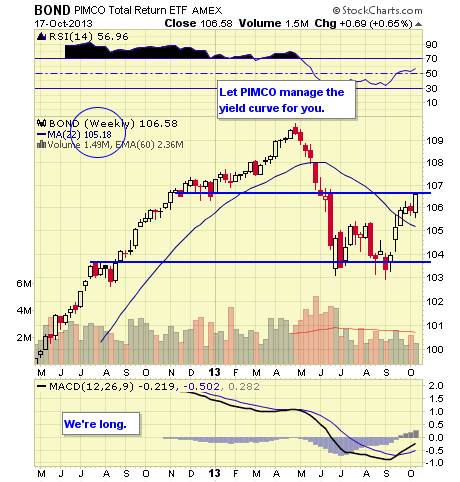
- BOND WEEKLY
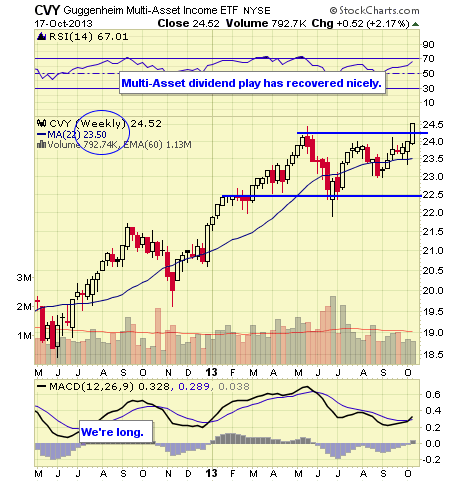
- CVY WEEKLY
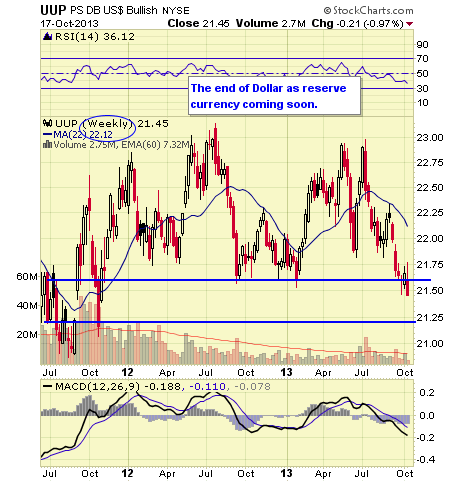
- UUP WEEKLY
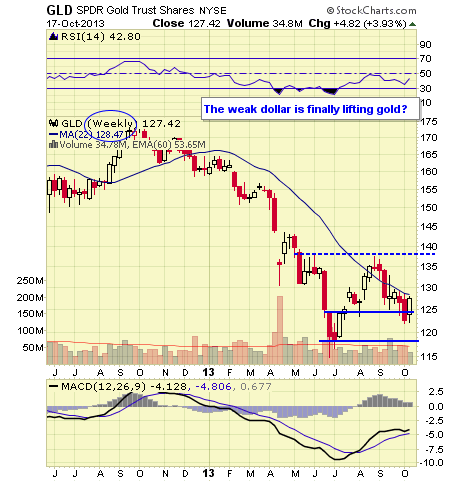
- GLD WEEKLY
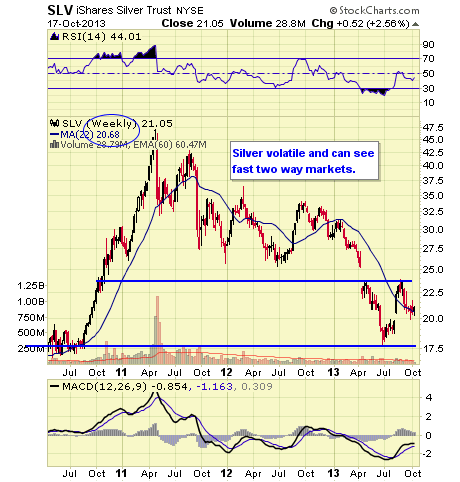
- SLV WEEKLY
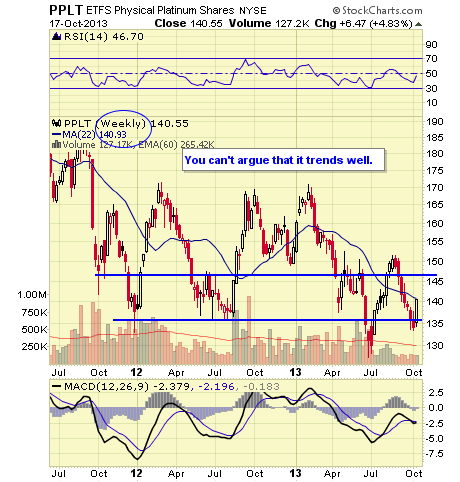
- PPLT WEEKLY
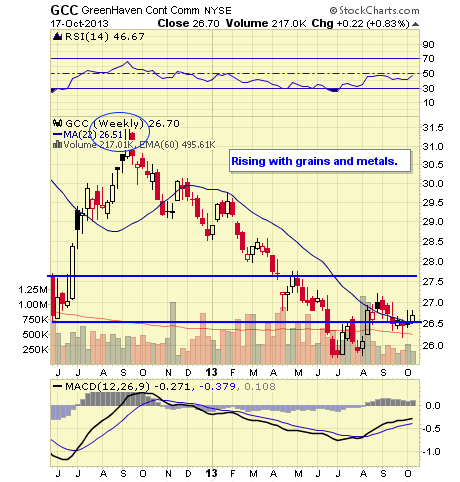
- GCC WEEKLY
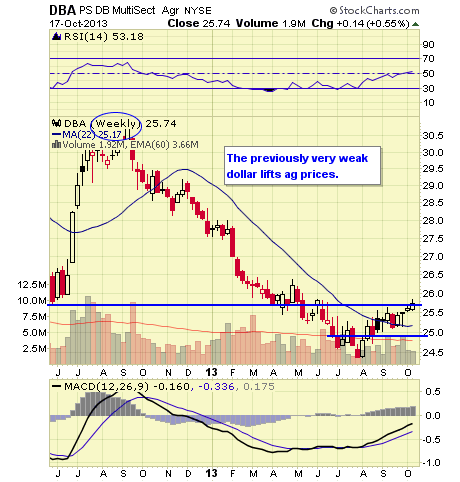
- DBA WEEKLY
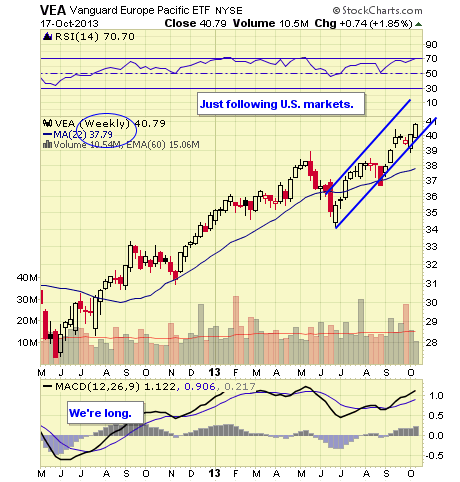
- VEA WEEKLY
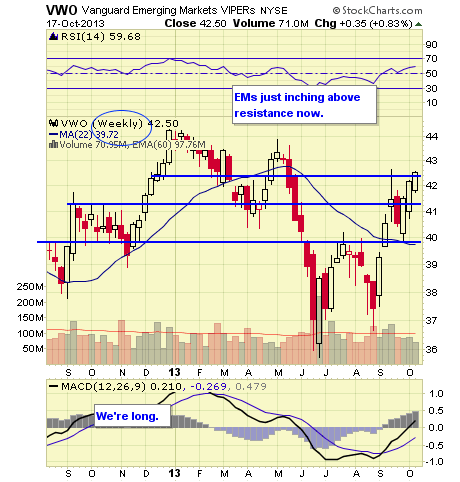
- VWO WEEKLY
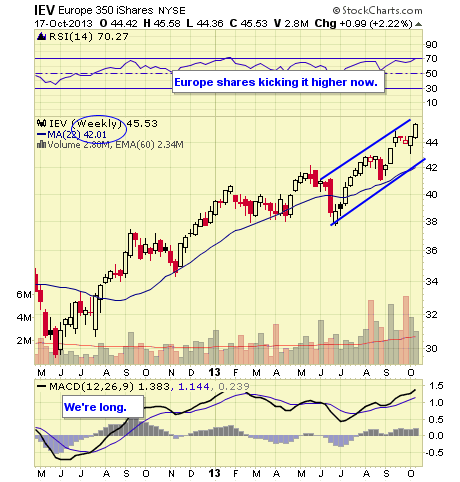
- IEV WEEKLY
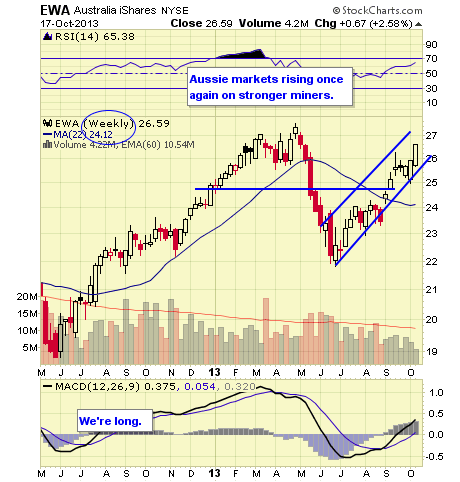
- EWA WEEKLY
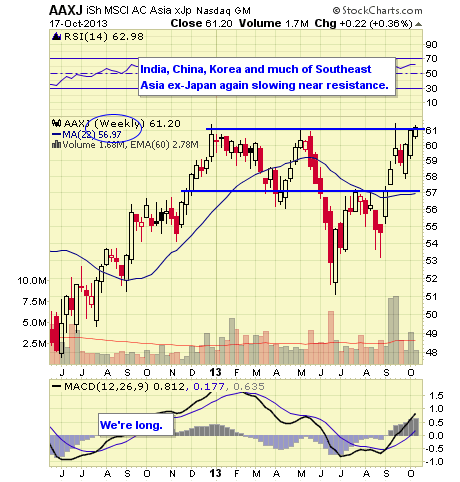
- AAXJ WEEKLY
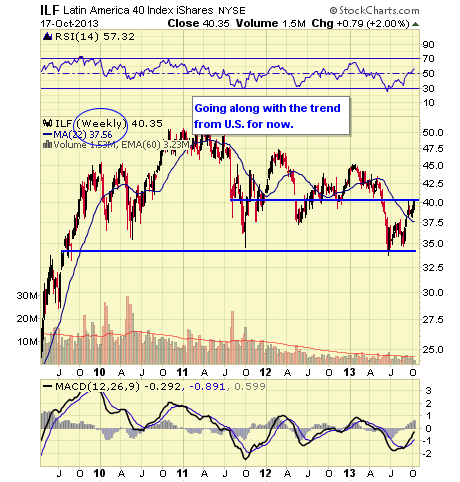
- ILF WEEKLY
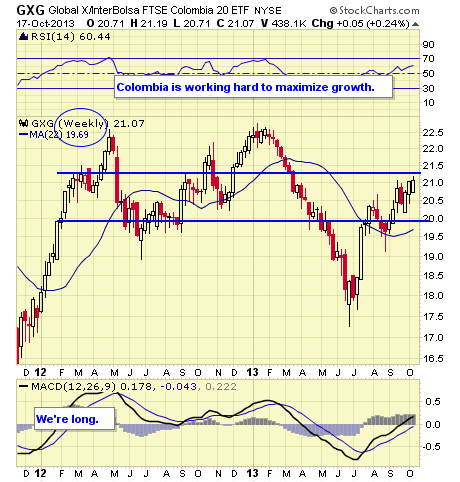
- GXG WEEKLY
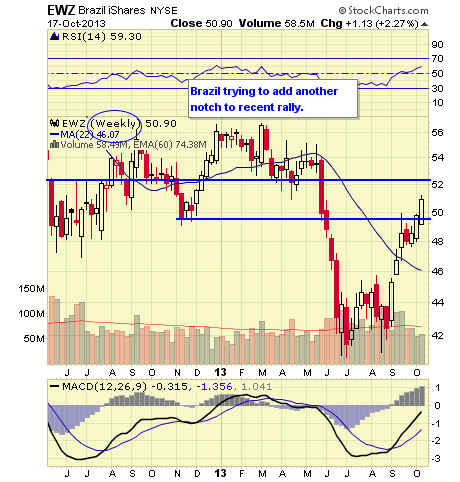
- EWZ WEEKLY
0 comments:
Publicar un comentario