A Tale Of Two Realities
Sep 7 2013, 00:01
by: David Fry

The much anticipated Non-Farm Payrolls report was a stinker. Not only did the number of new jobs (169K) miss expectations (180K) but the prior data was revised lower from 160K to a stunning 104K. Full time jobs were +118K and part time jobs -234K. The unemployment rate fell to 7.3% from 7.4%. Soon, with so many not looking for work (the labor participation rate currently at 1978 lows), the deceptive unemployment rate will fall to unimaginable lows. That's the statistical gimmick the methodology has created.
After the markets fell sharply on employment news, the bad news bulls appeared to rally stocks as they reasoned a Fed taper was unlikely this month given the perfectly bad data.
Later this afternoon, some wise guys in Syria claimed Assad launched another chemical weapons attack and markets started to fall into the close.
No, you shouldn't be able to make this stuff up, but they've been doing a good job of doing so the last decade.
In the end, neither bulls nor bears could gain the upper hand as the first of the three big September events passed. Next up is the Fed Meeting or Syria.
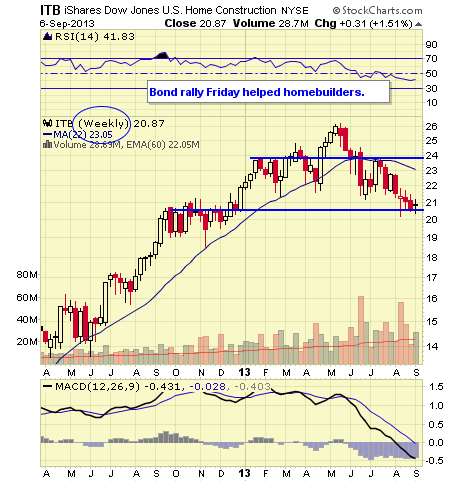
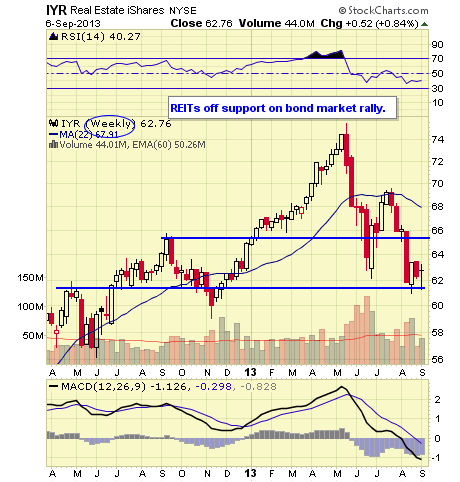
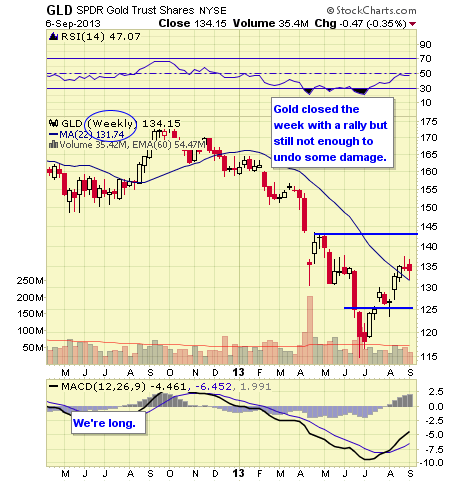
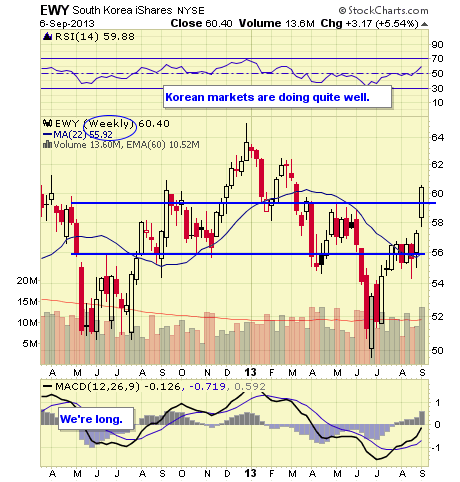
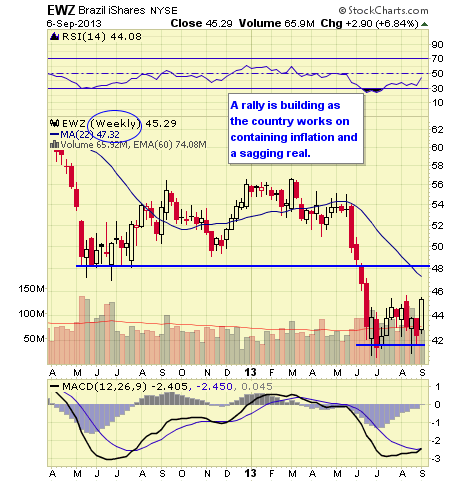
Markets moving higher Friday were mostly from previously beaten down sectors: Emerging Markets (EEM), Brazil (EWZ), Mexico (EWW), Korea (EWY), Homebuilders (ITB), REITs (IYR), Bonds (TLT), Gold (GLD) and Oil (USO). Everything else was more or less unchanged.
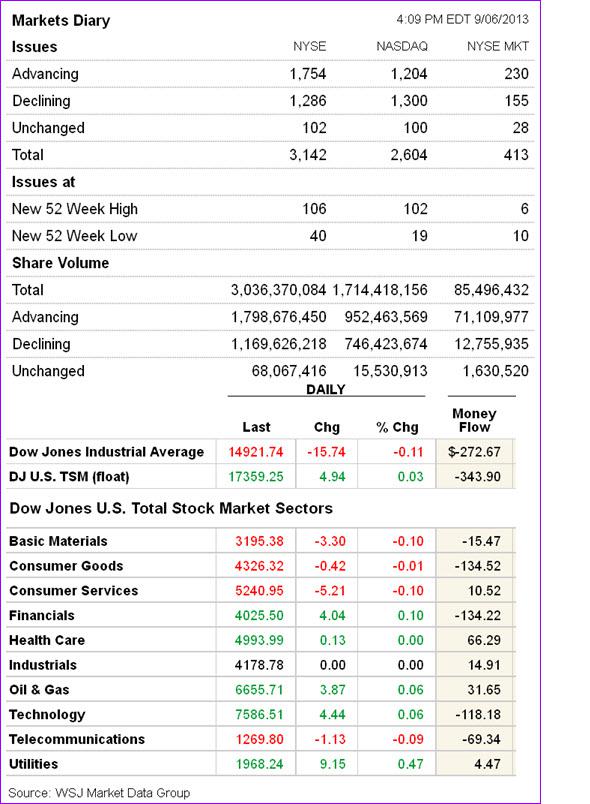
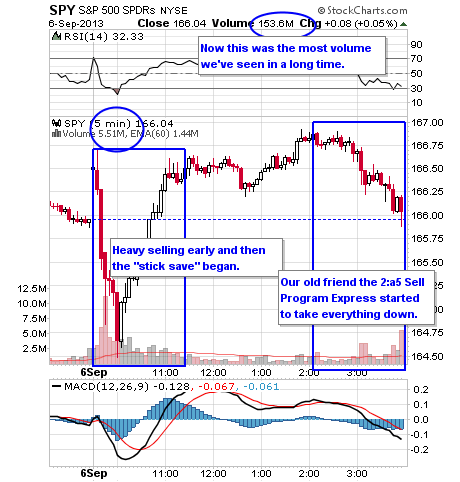
Volume was the heaviest we've seen in months as investors reacted to the employment report both logically to the downside and then cynically on the rally. Breadth per the WSJ was positive overall.
 )
)
- NYSI
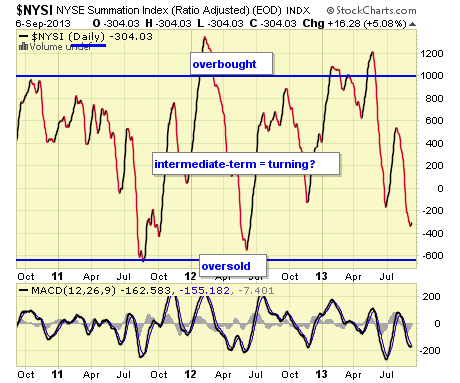
The McClellan Summation Index is a long-term version of the McClellan Oscillator. It is a market breadth indicator, and interpretation is similar to that of the McClellan Oscillator, except that it is more suited to major trends. I believe readings of +1000/-1000 reveal markets as much extended.
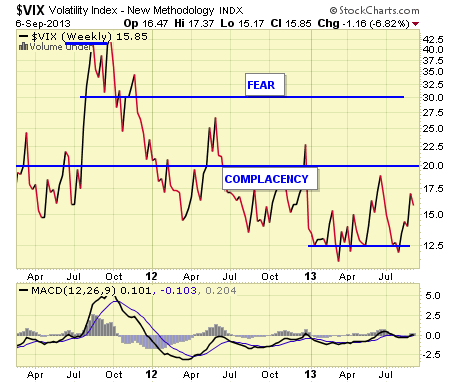
The VIX is a widely used measure of market risk and is often referred to as the "investor fear gauge". Our own interpretation is highlighted in the chart above. The VIX measures the level of put option activity over a 30-day period. Greater buying of put options (protection) causes the index to rise.
- SPY 5 MINUTE
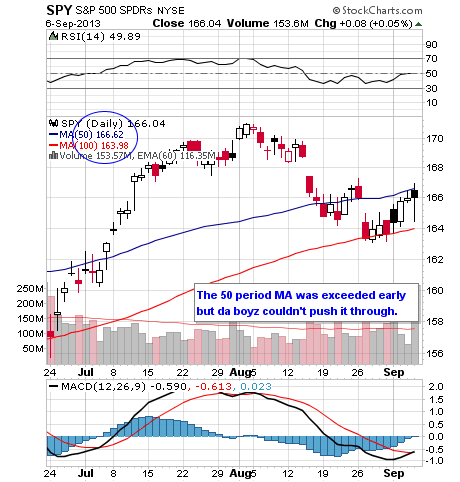
- SPY DAILY
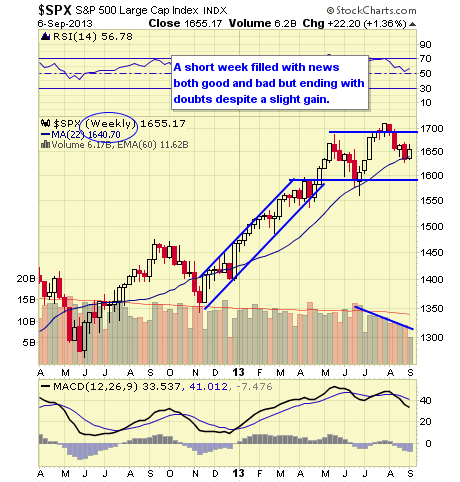
- .SPX WEEKLY
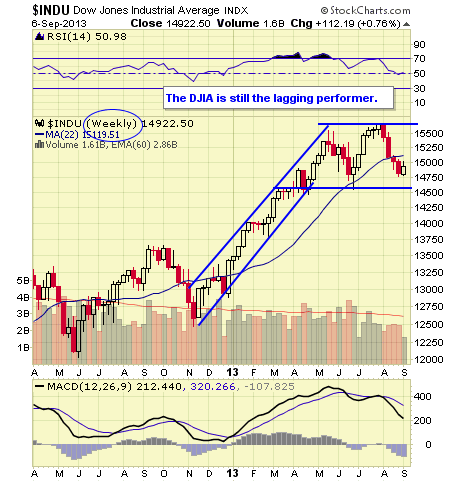
- INDU WEEKLY
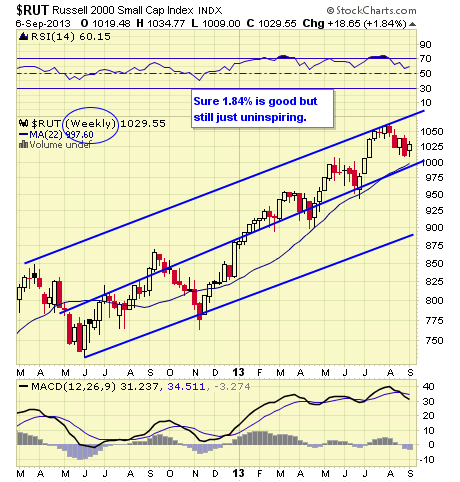
- RUT WEEKLY
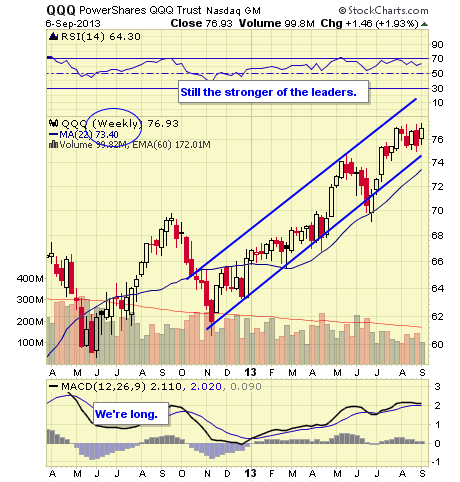
- QQQ WEEKLY
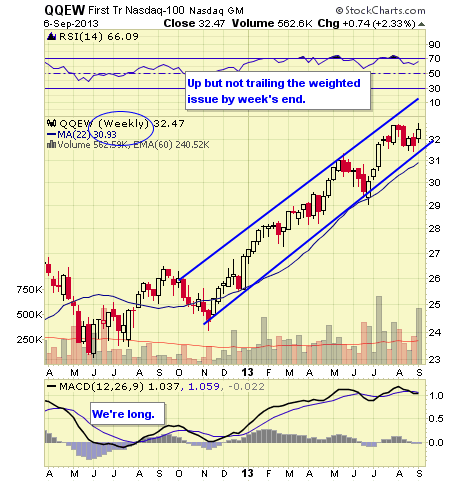
- QQEW WEEKLY
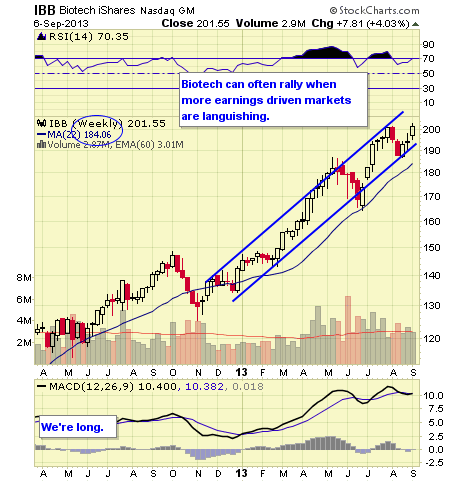
- IBB WEEKLY
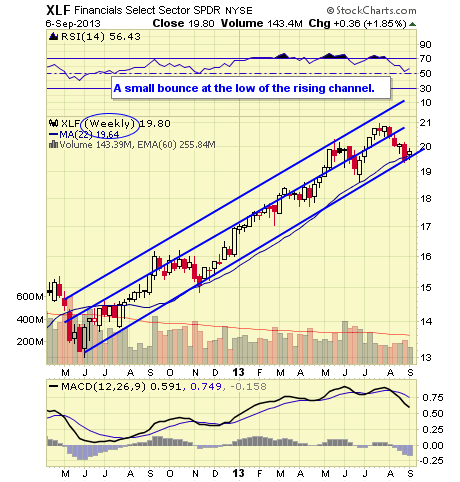
- XLF WEEKLY
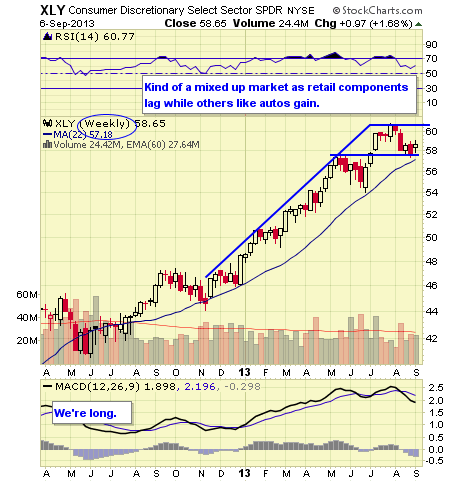
- XLY WEEKLY
- ITB WEEKLY
- IYR WEEKLY
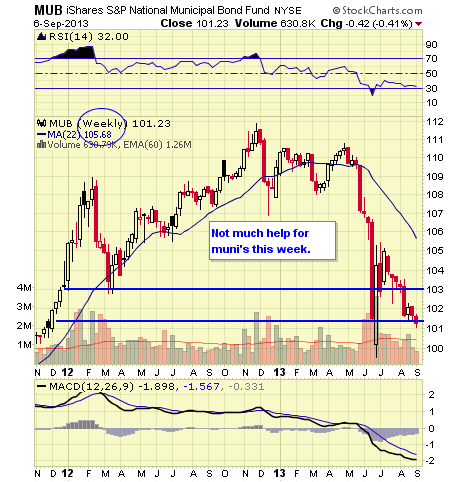
- MUB WEEKLY
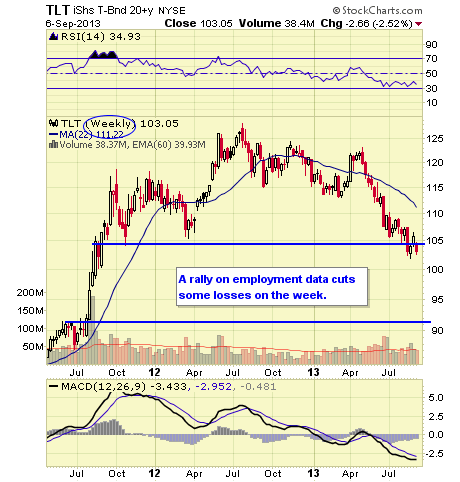
- TLT WEEKLY
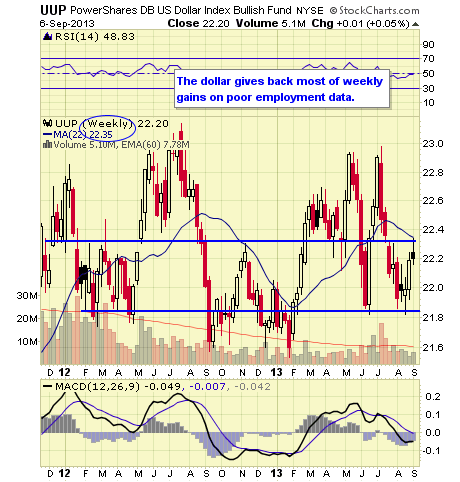
- UUP WEEKLY
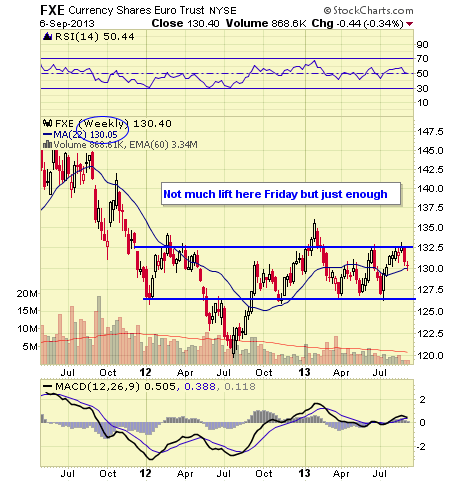
- FXE WEEKLY
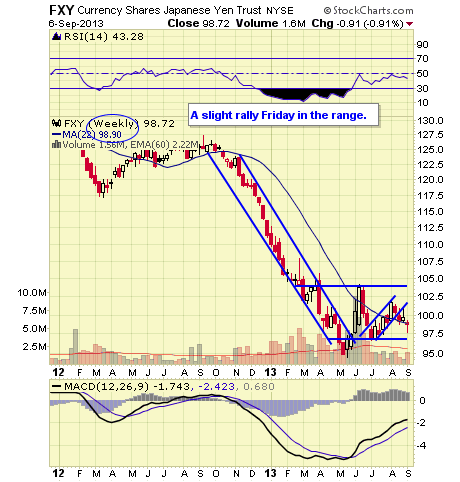
- FXY WEEKLY
- GLD WEEKLY
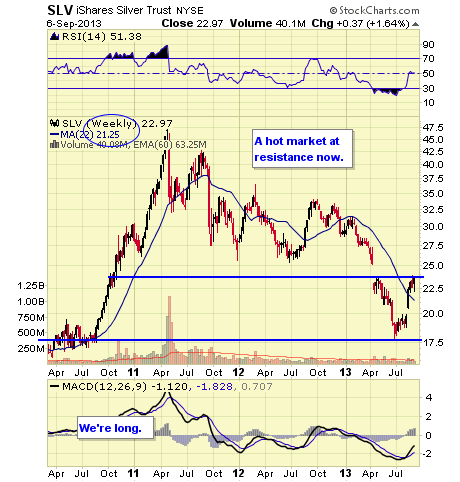
- SLV WEEKLY
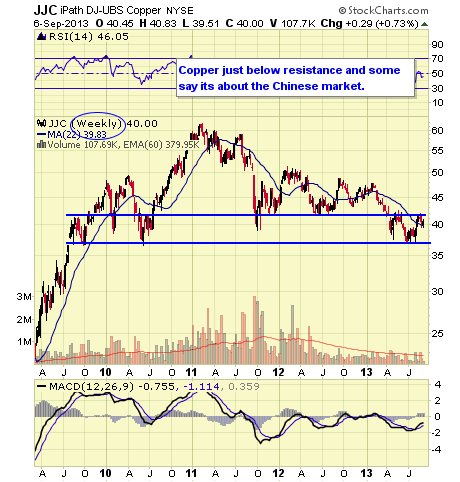
- JJC WEEKLY
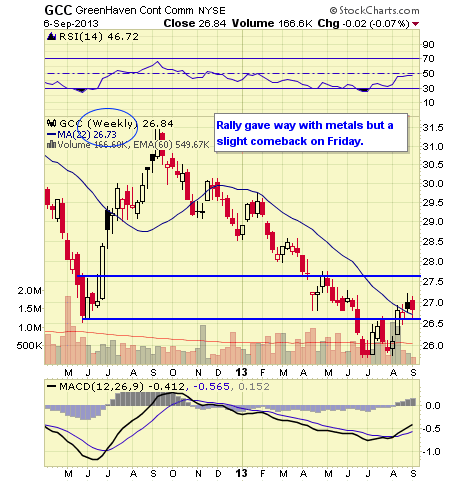
- GCC WEEKLY
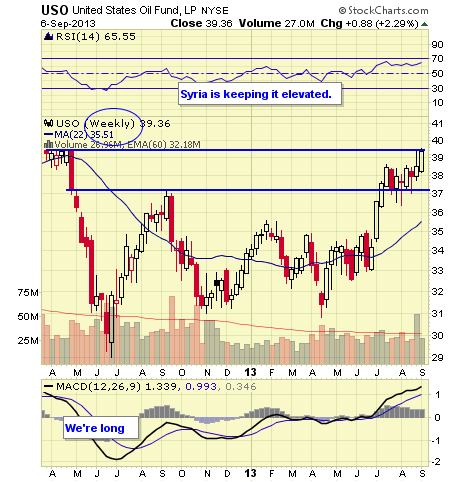
- USO WEEKLY
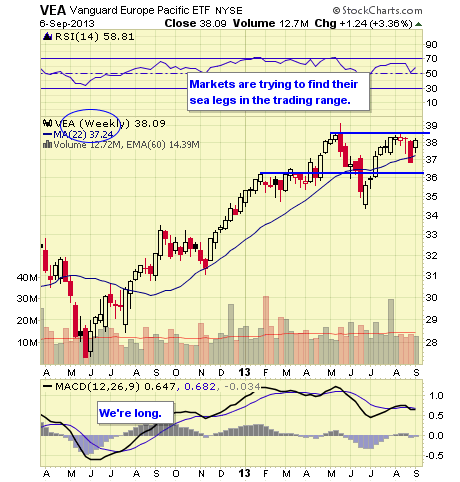
- VEA WEEKLY
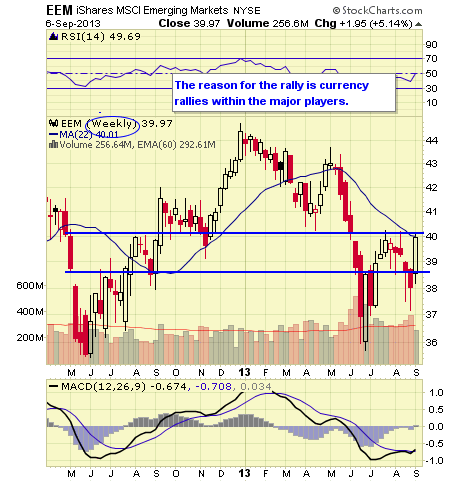
- EEM WEEKLY
- EWY WEEKLY
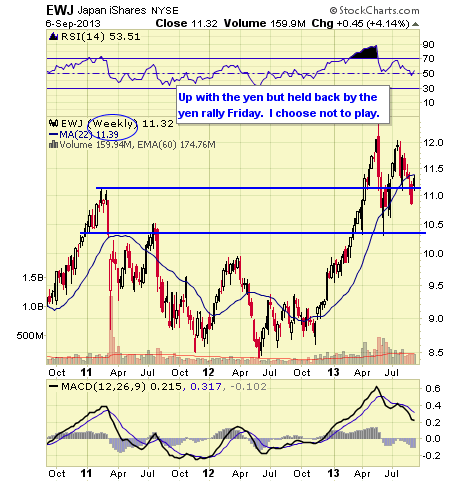
- EWJ WEEKLY
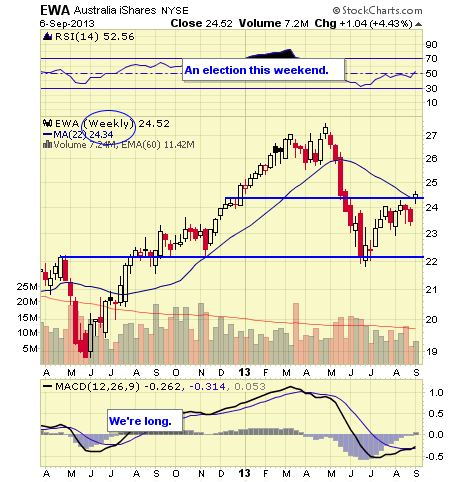
- EWA WEEKLY
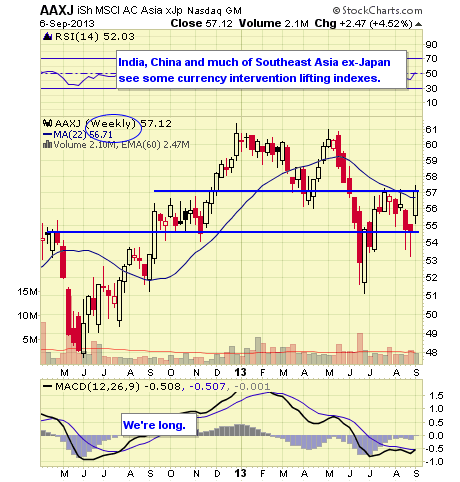
- AAXJ WEEKLY
- EWZ WEEKLY
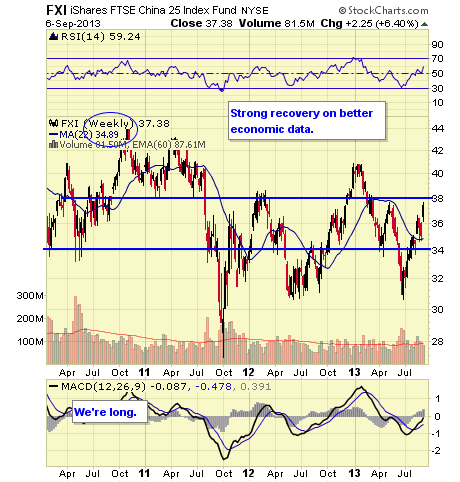
- FXI WEEKLY
The markets remain in Bizzaro Land. Surely the reality of ongoing unemployment and part time hiring to avoid Obamacare should weigh on markets more than we're seeing. On the other hand corporate buybacks financed by low interest rates and ongoing Fed liquidity injections are the new bullish norm. It's difficult to deal with these realities emotionally. But investors either must go with the dictates of the tape or stand aside.
Let's see what happens.
0 comments:
Publicar un comentario