The Paradigm Shift Has Begun - This Isn't Going To Be Pretty
Jun 11 2013, 08:03
by: Joseph Stuber
There's ample evidence of late that the Fed is trying to talk investors into moving back away from the edge of the cliff. My personal opinion is they are a little late and that opinion is based almost entirely on the structural flaws in the market today that leave very little dry powder left - in other words, there isn't enough money on the sidelines to backstop a high volume sell-off.
We have witnessed the impact to price when an overbought and overleveraged market starts to sell off - most recently with the Nikkei. We've also seen this phenomenon occur in gold and Apple (AAPL). I think we may be very close to seeing the same thing occur in the broad market in U.S. equities.
First, to the point of the Fed's messengers - here is an excerpt from a speech Jamie Dimon gave in China last Thursday as reported here:
"It's a different world when central banks are managing interest rates," Dimon said, referring to the Federal Reserve's orchestrated effort to keep long-term rates low. He reminded the audience that 10-year bond rates haven't been set by the Fed since World War II, and rates didn't normalize until around 1950. "Until it gets back to normal [this time], it's going to be scary and volatile."
Here's my question - do you think Dimon's comments were purely spontaneous? Please - don't be naïve - Dimon's comments were framed to send a message to the world and that includes investors. The message - things are about to change so be prepared. Anyone who honestly believes this statement wasn't reviewed and approved by the Fed is truly naïve.
If Dimon's comments on Thursday didn't get the job done, here is what the Fed's messenger - John Hilsenrath - said on Saturday:
"Federal Reserve officials are likely to signal at their June policy meeting that they're on track to begin pulling back their $85-billion-a-month bond-buying program later this year, as long as the economy doesn't disappoint.
"A good-but-not-great jobs report Friday ensured officials wouldn't want to act right away and would instead want to see more data before taking a delicate step toward winding down the program.
Do you get it or not - the Fed is telling investors to back off. Whether the Fed actually does curtail asset purchases is really not the point. The point is they are trying to ease investors back away from the edge of the cliff in a way that doesn't create instant panic. Good luck with that one - investors are usually "all in" until they are "all out".
So what do normalized rates look like? Here is the yield curve today and compared to the yield curve before the Fed's failed QE experiment in 2007 for those who have forgotten what normal looks like:
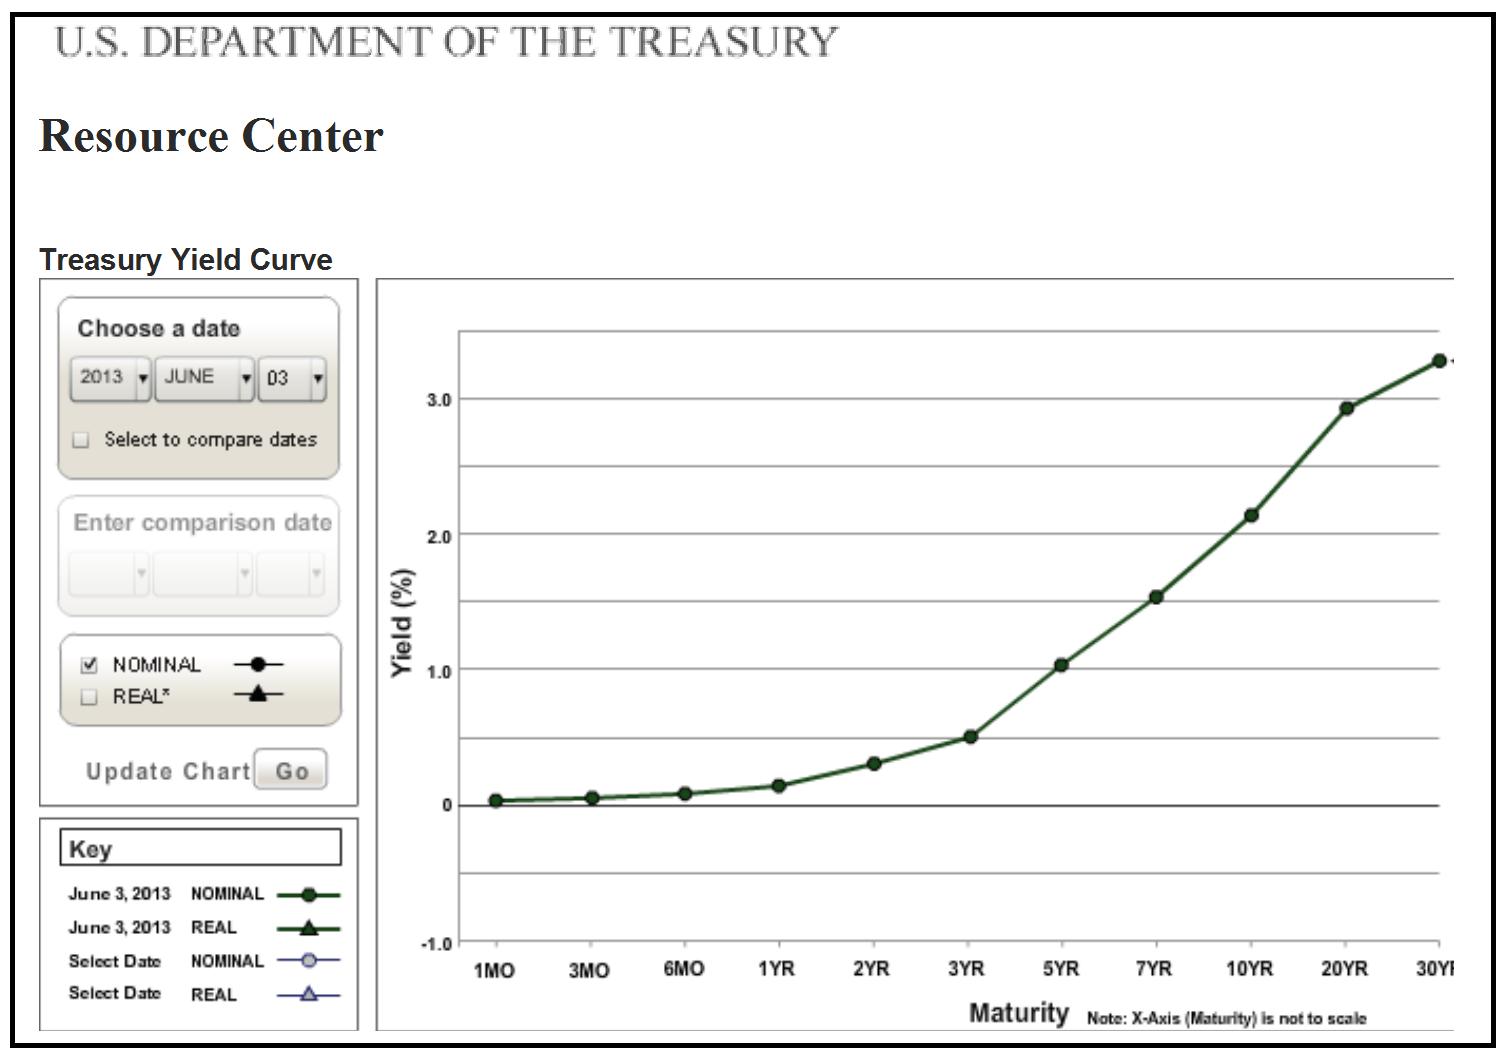
(Click to enlarge)
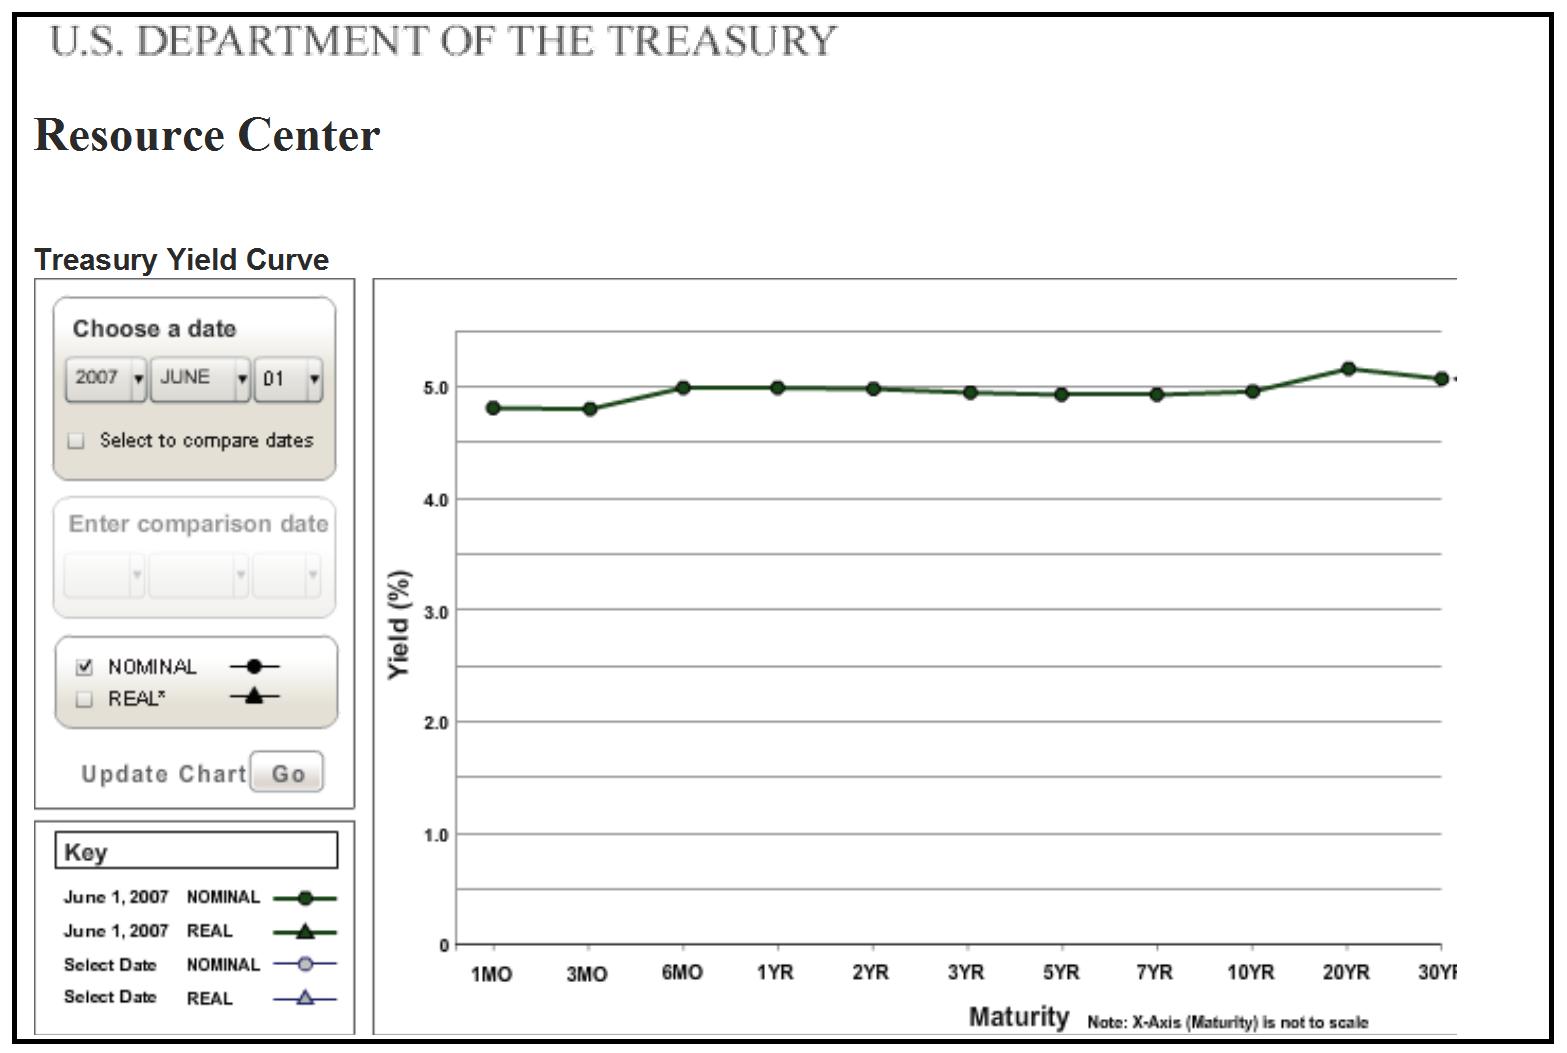
(Click to enlarge)
Here's a look at the 30 year:
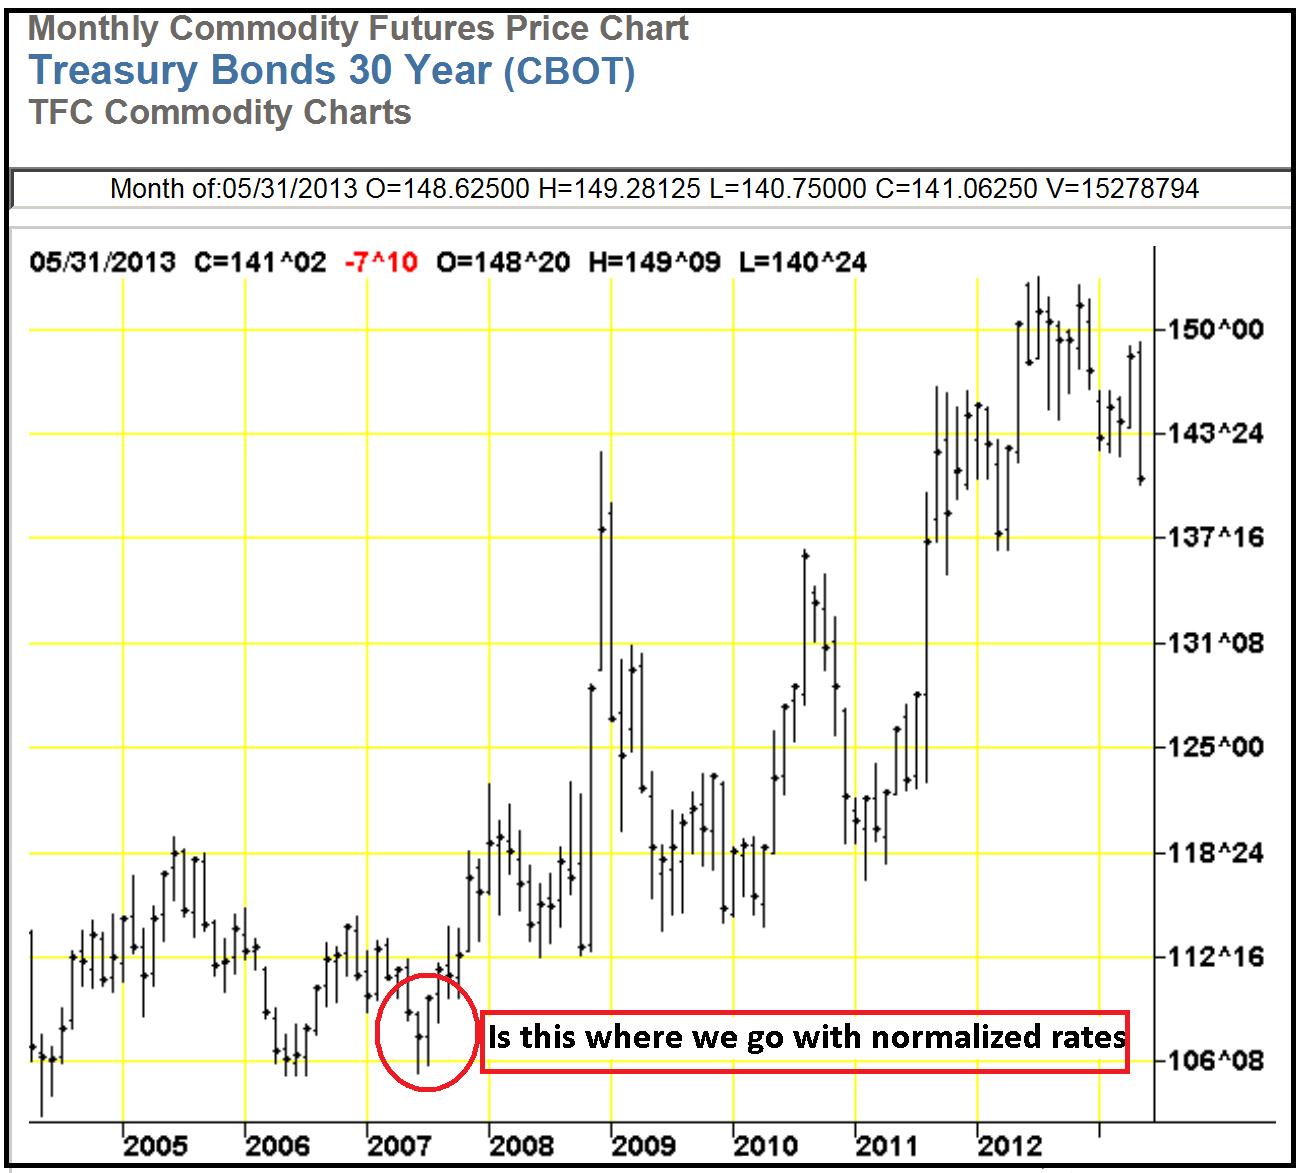
(Click to enlarge)
To develop my thesis, I need to explain what has happened that creates a structurally flawed market. It has to do in part with the amount of leverage employed by traders and investors but also leverage that has been implemented by the primary dealer banks. This leverage is almost impossible to measure, but it is real and I believe that when that leverage is factored into the over leveraged position that exists in the rest of the market, we probably have leverage at levels that far exceed anything we have ever seen before.
This is an incredibly dangerous and potentially devastating situation if the markets continue to be volatile and move lower. As Jamie Dimon so aptly stated ". . .it's going to be scary and volatile. "
Here is a definition of carry trade from the Financial Times Lexicon and it is important to this discussion:
A carry trade is a strategy in which an investor borrows money at a low interest rate in order to invest in an asset that is likely to provide a higher return. This strategy is very common in the foreign exchange market. For example, in the period up to 2007 many investors borrowed in Japanese yen or Swiss francs, taking advantage of very low interest rates in Japan and Switzerland, and used the money to take long positions in currencies backed by high interest rates, such as the Australian and New Zealand dollars and South African rand.
This strategy relies on relative stability in asset prices, as an adverse exchange rate movement can easily wipe out the returns from the underlying interest rate differential. This leads some to refer to the carry trade as akin to picking up pennies in front of a steamroller.
The yen carry trade reversed sharply in 2007 as global interest rate differentials narrowed, causing the yen to rally against currencies such as the antipodean dollars.
The definition accurately defines what I think has gone on for some time now with the primary dealer banks. Here is how it works. The Fed prints money by purchasing assets - Treasuries or mortgage backed securities - from the primary dealer bank. The bank then has cash which it uses to buy another bond at the long end of the curve where returns are higher. Here is where the leverage is ramped up - the bank then hypothecates that bond to a third party and gets cash in return on a short-term arrangement. The bank then has off balance sheet cash which it uses to buy stocks.
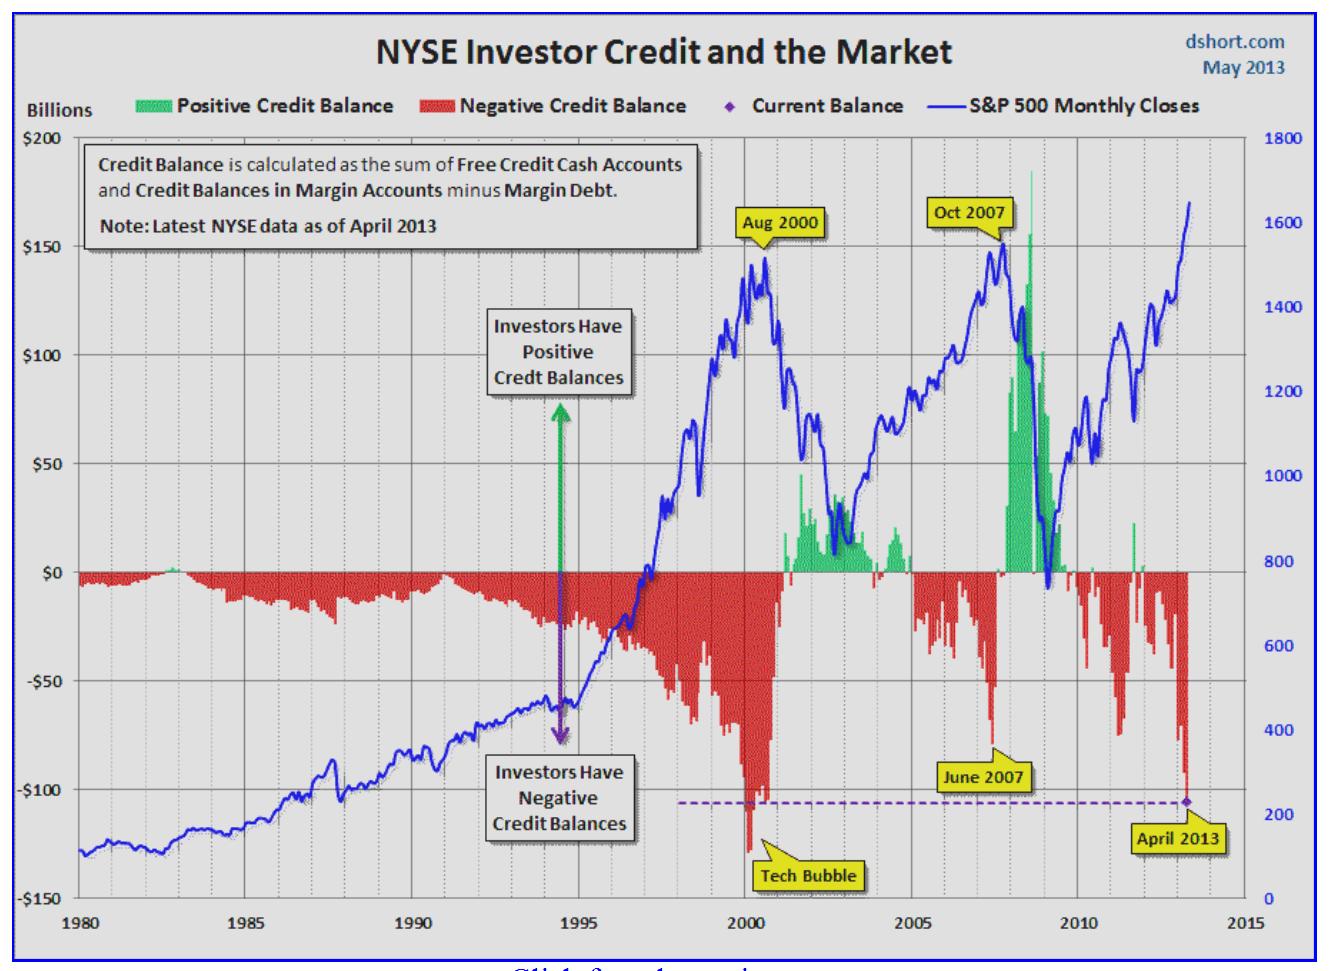
Think that isn't happening - take a look at this chart:

(Click to enlarge)
Here is the point - Bernanke's "virtuous circle" theory was ramped up dramatically in December of last year with QE4. The other big proponent of failed QE policy - Japan - has done the same. The correlation to the Fed's balance sheet expansion dating from the start of QE4 is almost perfect suggesting that the thesis set forth above is true. The Fed's money has moved directly into stocks in an unprecedented form of a double down carry trade play.
And has it worked - stocks are up 14% to 15% in 6 months and on highly leveraged plays via hypothecation strategies that result in big off balance sheet gains. But what now as the Nikkei and the U.S. equities markets seem to be stalling - well in the case of the Nikkei - crashing?
Keep in mind the leverage employed in today's market is very high by historical standards but my guess is it's even higher than the chart below suggests since it fails to take into account the leverage employed by the primary dealer banks.
(Click to enlarge)
How much extra and unaccounted for leverage are we talking about here? Well, if my thesis is correct, it could be well in excess of the number reflected above. Here is why - the primary dealer banks who are buying stocks are doing so on borrowed money - i.e., through the hypothecation of securities they have purchased equities with depositor funds.
The Fed has expanded their balance sheet since QE4 by roughly $600 billion and that sets up the case for arguing that almost all that money has gone into equities - at least that is the extreme case. Consider also that if that is the case the historically high level of margin debt - at roughly $380 billion - is dwarfed by the potentially massive leverage being employed by the primary dealer banks under my hypothecation scenario. The number just since QE4 was announced could be as high as $600 billion. And we don't know how much of the QE money prior to QE4 was employed in the same manner, but we do know however much it is, it doesn't show up in the numbers anywhere.
The dire consequence of a structural imbalance in the markets
"This leads some to refer to the carry trade as akin to picking up pennies in front of a steamroller."
It can't be said that a 15% gain with the Fed's money produced by borrowing against bonds to invest in stocks is "pennies" but the "steam roller" part is likely to be true. Here is the important point - there may be no dry powder left to prop the markets.
It is reasonable to argue that we are moving very close to a margin call crisis and any further sell-offs will precipitate that crisis. Don't summarily reject that point please. Instead look at gold or Apple or the Nikkei. As stocks move lower in a highly leveraged environment, the amount of available credit shrinks and eventually turns to a negative number. What happens then - investors must address the problem by selling assets.
What happens when everyone is selling and no one has any money to buy with? The bid side of the trade disappears. That is where we are based on what we know, but we don't know where the primary dealer banks are or do we? I think we do and I - like most traders - assume that the big banks are the "smart money" and wouldn't make a dumb move like over leveraging and putting the whole system in peril but on further reflection that is sheer nonsense.
Didn't JPMorgan (JPM) do just that a while back? Isn't that why they were called to task in hearings before the Senate back in March? Of course it was and the problem - their VaR model was flawed but according to testimony it has been fixed - yeah, right, and isn't that a load off your mind?
Here is how Paulo Santos explains the VaR models response to volatility:
Now imagine that for some reason, volatility increases for a while. This will in turn show up as an increased level of risk in all those institutions using VaR. A higher level of volatility will mean that the loss that can happen on any given day will be higher. The natural reaction will be to reduce overall exposure.
This means that an increase in volatility can breed selling and thus more volatility. Worse still, if the selling happens over the whole portfolio, this will increase pressure in several assets at the same time, also increasing correlations between them. This explains how in times of volatility, correlations also usually go up.
Now, both the increased volatility and the increased correlations between assets again increase VaR. This leads to more selling, which in turn leads to more volatility and higher correlation between assets. And that is the mechanism which can easily make volatility feed on itself.
That should be enough said, but consider what we have seen of late in the various asset classes that make up a typical investment portfolio - bonds, stocks and precious metals.
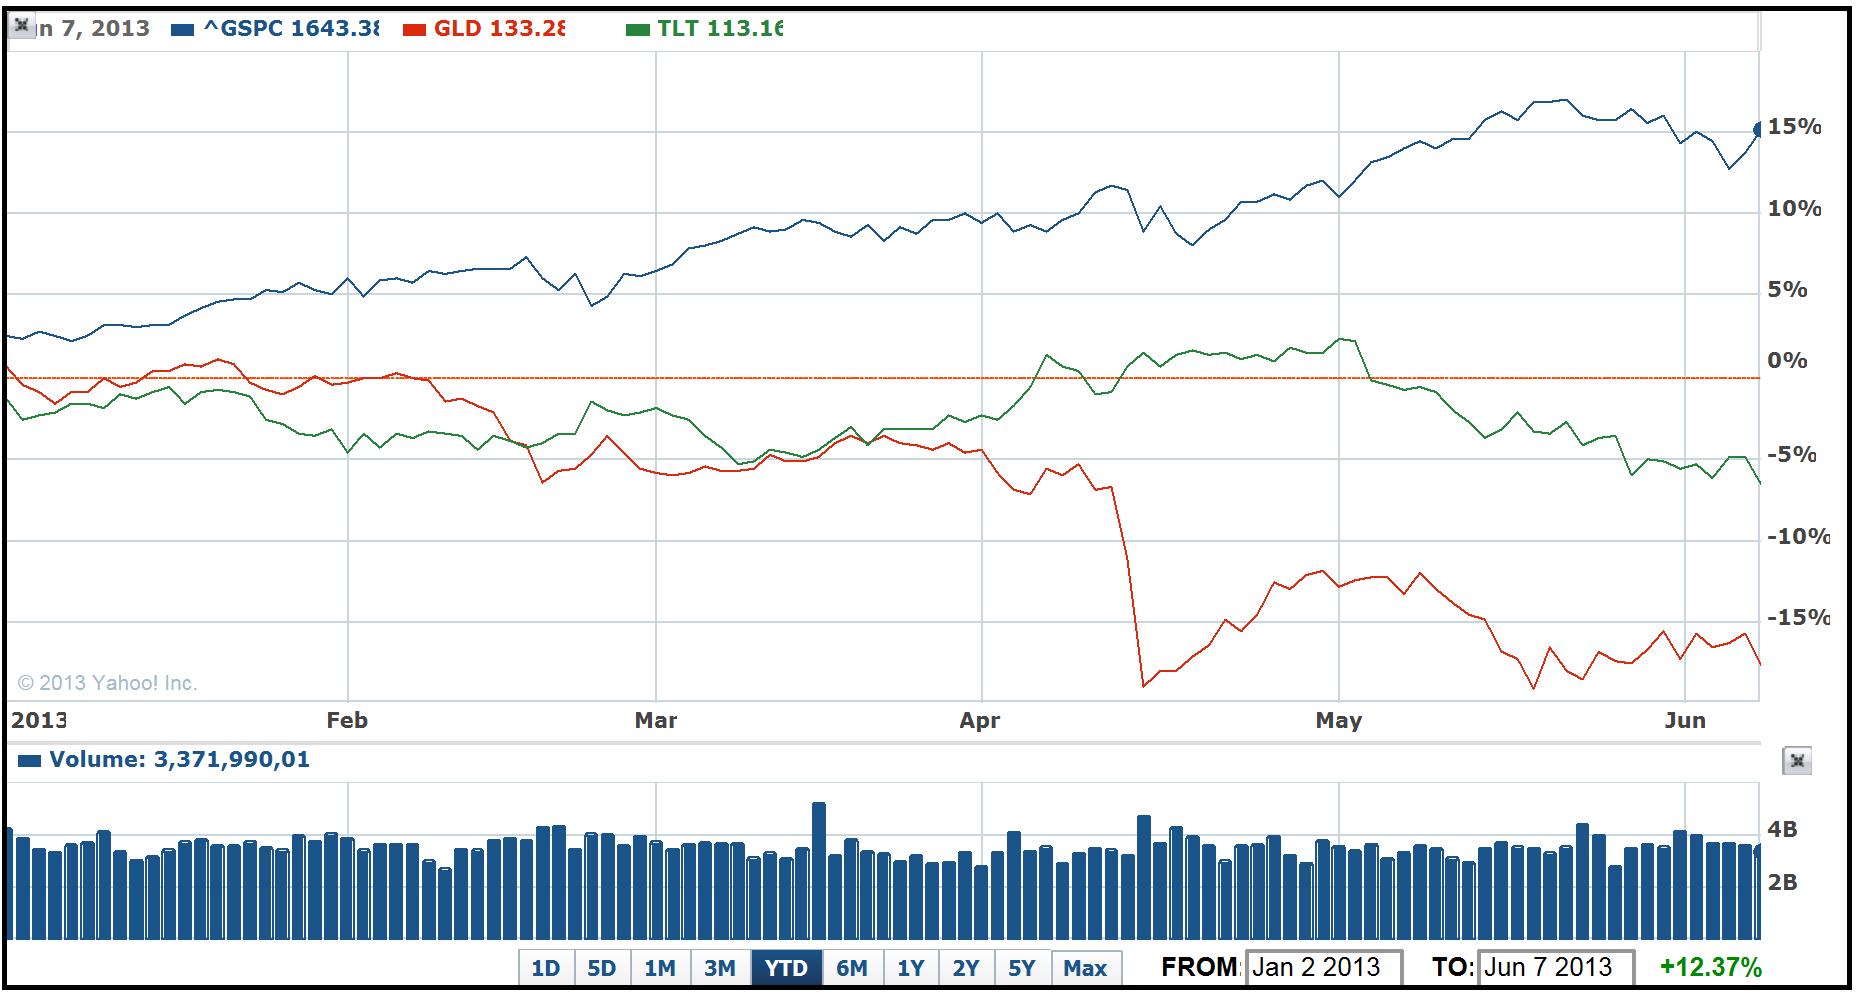
(Click to enlarge)
Bonds as represented here by (TLT) are down 6% or 7%. Gold is down 17% or so and equities as represented by the S&P (SPY) are up roughly 14%. But on Friday look what happened to bonds and gold:
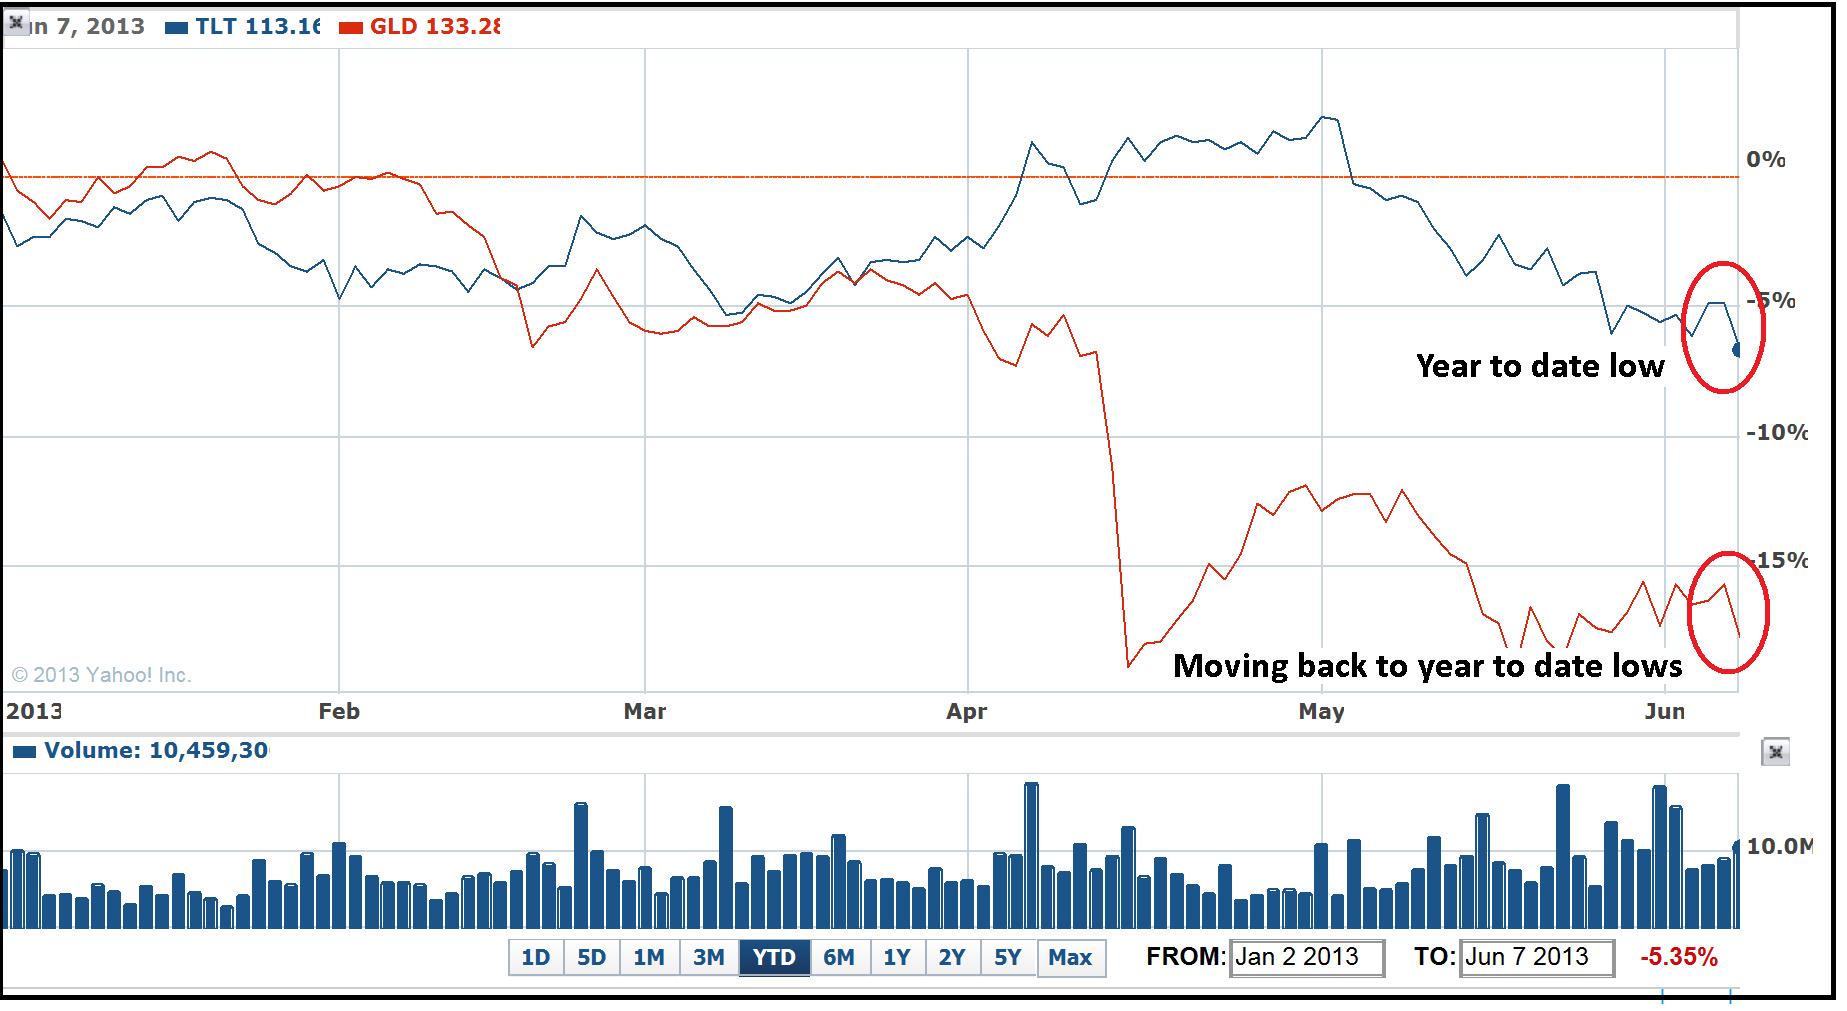
(Click to enlarge)
I don't know where the tipping point is on U.S. equities, but my guess is we don't have far to fall before reaching that point. We got a brief reprieve on Thursday and Friday, but if we fail to hold those gains and move below the 50 day MA at this point and gold and bonds continue their slide, I would suggest that may be the tipping point.
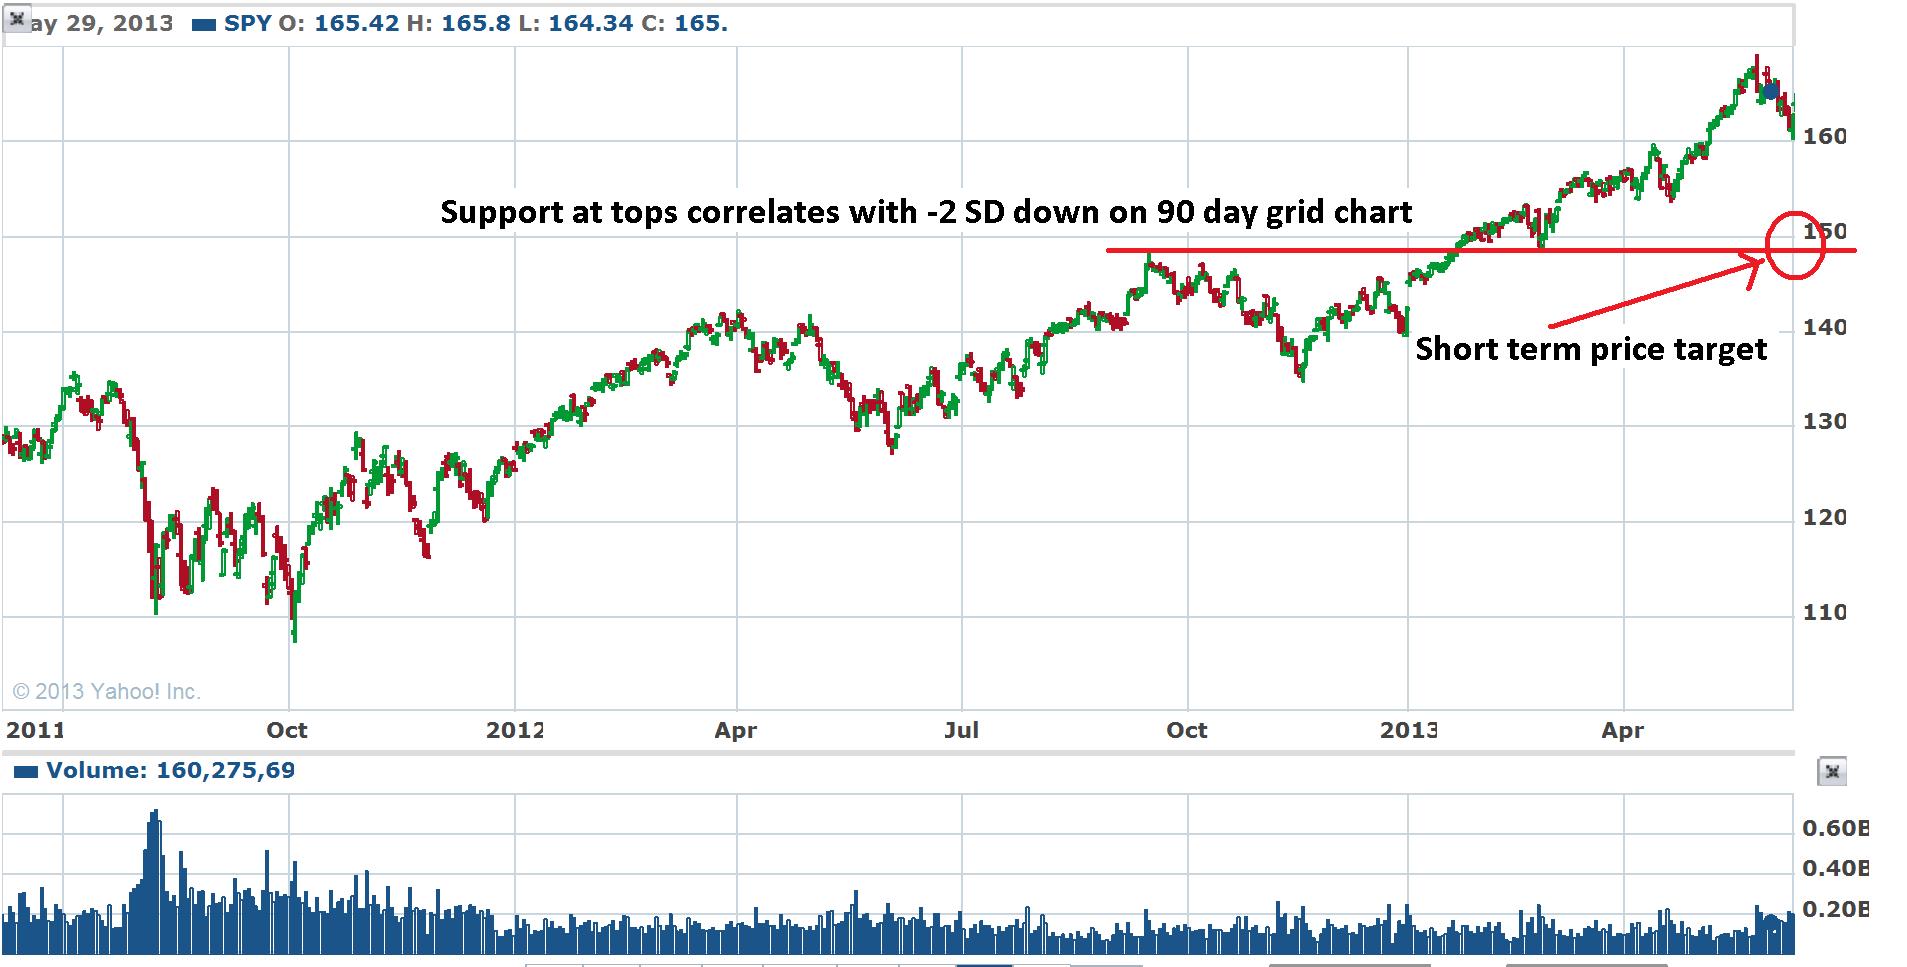
A look at the Nikkei and the S&P 500 show some similarities, but the Nikkei is well ahead of the S&P. The next two charts show the close of the Nikkei and SPY with the 90 day mean and the +/- 2 standard deviation bands included:
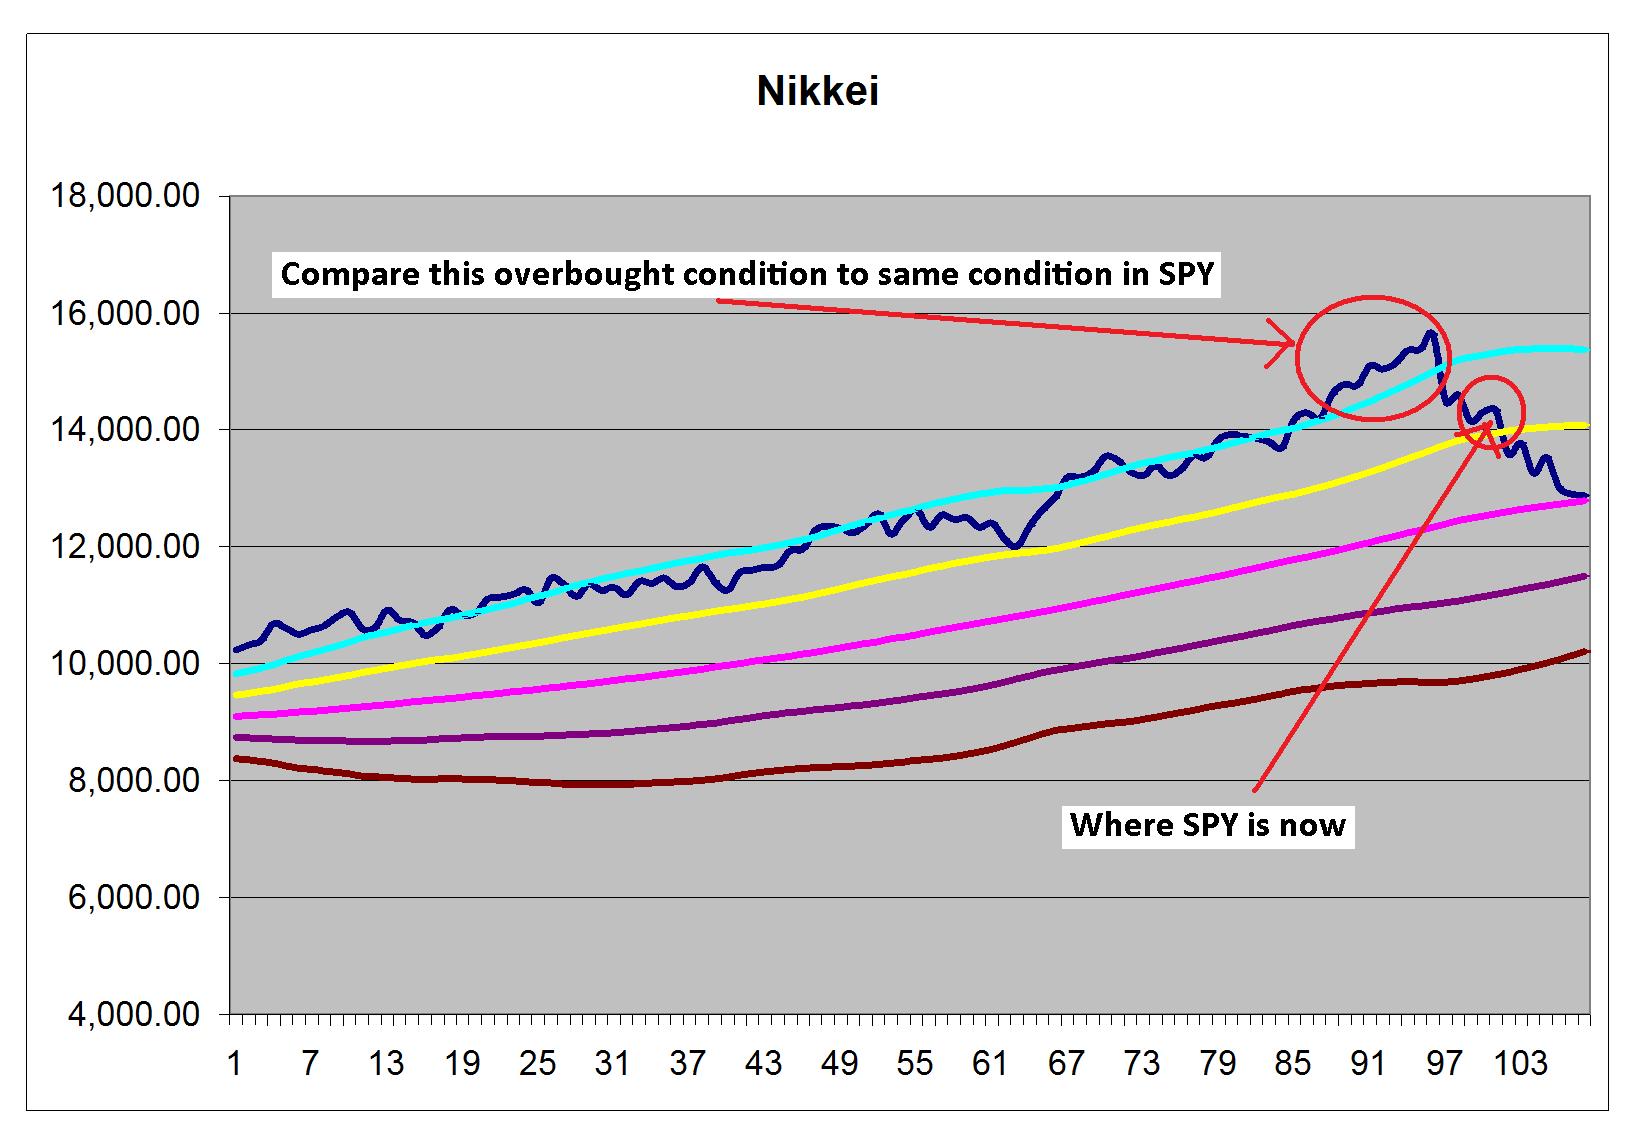
(Click to enlarge)

(Click to enlarge)
The Nikkei has a very similar pattern to the S&P. They both peaked on the same day and they both were in overbought territory above the +2 standard deviation band for several days prior to peaking and moving lower. Additionally they both hugged the +2 standard deviation band for a number of weeks before extending into overbought territory and finally peaking and reversing trend.
The only difference in the two charts is that SPY's fall has been more subdued and indicates it is lagging the Nikkei. That said, the probability of both moving to the -2 standard deviation level in the next few weeks is now very high. In particular, the Nikkei which has now moved below the 90 day mean value has an extremely high probability of moving back to the -2 standard deviation level at 10,204.
If SPY follows the same pattern it will bottom out at 146.90. Here's a look at the daily OHLC charts for the Nikkei and SPY:
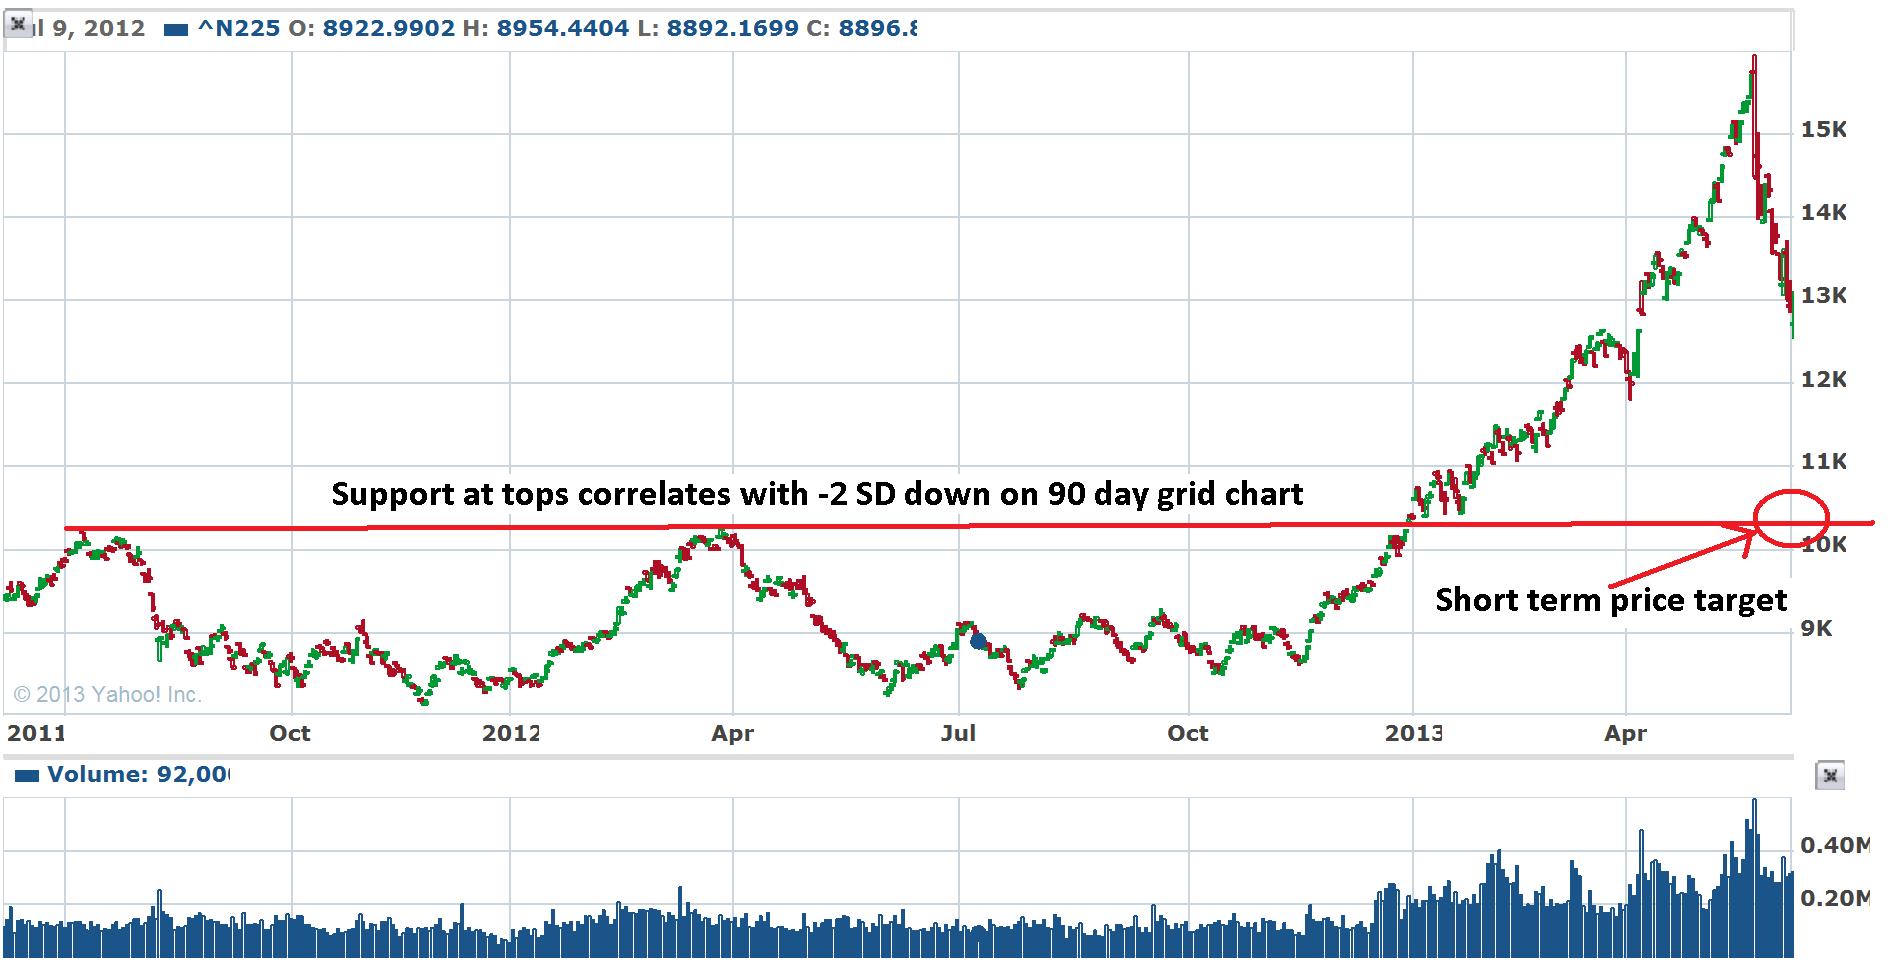
(Click to enlarge)
The Nikkei is now in the kind of structurally driven negative feedback loop that I think we will see in U.S. equities in the next two weeks.
(Click to enlarge)
Concluding thoughts
I've given a lot of thought to how this Fed driven bull market might end and what might be the cause. I've given some consideration to an unforeseen "black swan" type event and that may still occur, but I think the more likely cause will be the Fed's loss of control of the bond market.
In a market that is not structurally imbalanced, a sell-off in bonds wouldn't imply a similar sell-off in stocks, but there is nothing at all normal in the structural flaws the Fed has created. The logic some might use is that as bonds fall, traders will exit bonds in favor of stocks but in a highly leveraged and overextended situation that may not be possible. My guess is all assets fall at the same time and create a negative feedback loop where selling begets selling.
0 comments:
Publicar un comentario