This Summer Slowdown Will Be Different Than The Previous Three
Apr 28 2013, 07:01
by: Lawrence Fuller
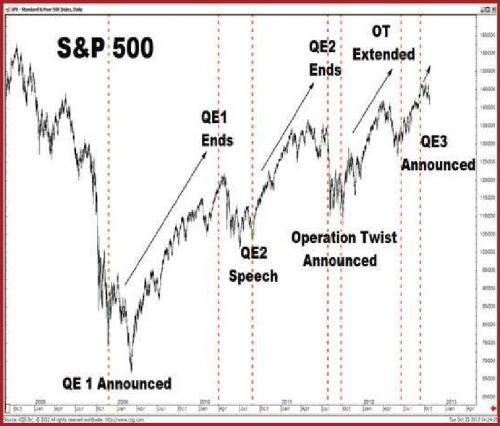
We can point to different adverse economic and political factors on both the domestic and international fronts as reasons for each of these corrections, but I think most investors will agree that the one constant and pre-eminent factor was the conclusion of the quantitative easing [QE] program that was underway at those times. Consequently, it was the announcement and implementation of a new QE program that ignited, and possibly fueled, the subsequent rallies. The pattern depicted in the chart below can't possibly be a coincidence.
(click to enlarge)
.
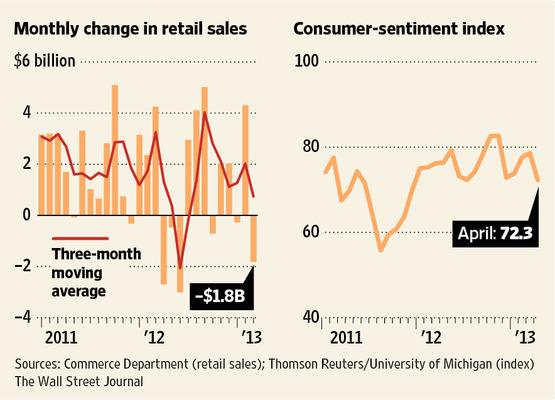
It is still debatable as to whether or not a new correction in equities is underway. We have only realized a 3% pullback from the April 11 closing high of 1,593. Still, the deterioration in the economic reports that we have grown accustomed to seeing in the spring of each year is without question happening again. April's high-frequency economic data has been a steady drumbeat of declines, short falls and missed expectations that even seasonal adjustments are unable to gloss over.
Following a very weak employment report for March, we learned that wholesale inventories recorded their biggest decline in 18 months in February. We also saw consumer sentiment fall to its lowest level in nine months, and retail sales for March decline .4% when a gain was expected.
(click to enlarge)
The regional manufacturing indexes for the Empire State and Philadelphia both declined, falling below expectations, with the Richmond Fed survey moving into negative territory. Also surprising the consensus, the Markit US flash purchasing managers index fell in April from a previous reading of 54.6, to 52.0, which was the lowest reading in six months. The Chicago Fed's national activity index further confirmed the deceleration, showing slower economic growth that was led by declines in production and employment-related indicators.
Recently, we learned that orders in March for durable goods logged their largest drop in seven months, but much more disconcerting was the year-over-year rate of change, because orders for durable goods in the first quarter of this year have now fallen .1% below the orders we saw in the first quarter of last year. Core orders, which exclude the volatile transportation sector, have fallen .5%. Despite the overwhelming evidence of a severe slowdown at hand, I continue to read research reports from strategists wearing QE-colored glasses that say that these stats are just noise in the underlying data. I'm not sure what underlying data they are referencing, other than the ticker tape.
With an established pattern at hand and evidence that it is repeating once more, I think it is important to note that the economy is in a significantly more weakened state today that it was just prior to the three previous economic slowdowns in 2010, 2011 and 2012. Below you can see a chart of the Institute for Supply Management's purchasing manager index dating back to January 2010, which depicts a series of lower highs and lower lows each year. If this were a stock chart, you would not have it on your buy list. As we enter the fourth consecutive summer slowdown, the PMI is flirting with the level of 50 that marks contraction.
(click to enlarge)

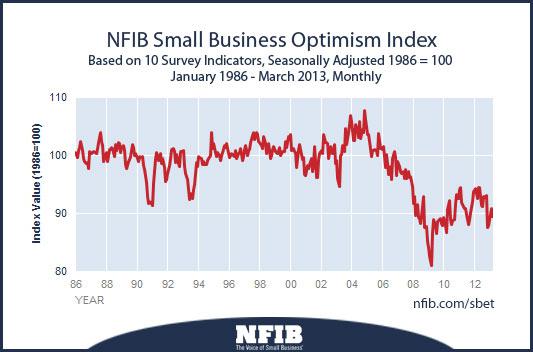
When I examine the outlook our "job creators" have for the US economy, based on the NFIB small business optimism index, it is weakening to levels we last saw at the early stages of recovery in 2010.
I have included the monthly readings in a spreadsheet below the chart that depicts the year-over-year declines in this index for the first three months of this year. Small business accounts for approximately half of our private sector economic growth and employs approximately half of the private sector work force.
(click to enlarge)
| Jan | Feb | Mar | Apr | May | Jun | Jul | Aug | Sep | Oct | Nov | Dec | |
| 2008 | 91.8 | 92.9 | 89.6 | 91.5 | 89.3 | 89.2 | 88.2 | 91.1 | 92.9 | 87.5 | 87.8 | 85.2 |
| 2009 | 84.1 | 82.6 | 81.0 | 86.8 | 88.9 | 87.9 | 86.5 | 88.6 | 88.8 | 89.1 | 88.3 | 88.0 |
| 2010 | 89.3 | 88.0 | 86.8 | 90.6 | 92.2 | 89.0 | 88.1 | 88.8 | 89.0 | 91.7 | 93.2 | 92.6 |
| 2011 | 94.1 | 94.5 | 91.9 | 91.2 | 90.9 | 90.8 | 89.9 | 88.1 | 88.9 | 90.2 | 92.0 | 93.8 |
| 2012 | 93.9 | 94.3 | 92.5 | 94.5 | 94.4 | 91.4 | 91.2 | 92.9 | 92.8 | 93.1 | 87.5 | 88.0 |
| 2013 | 88.9 | 90.8 | 89.5 |
The US consumer is now clearly under far more financial duress than at any other point in the prior three years. Real disposable incomes are declining year-over-year, and the savings rate has fallen to just 2.6%. Consider the first-quarter earnings reports for Coach (COH), which performed very well, and Target (TGT), which clearly did not. Which company better exemplifies the spending power of the typical American consumer? Here is another example; we know that Americans like to eat out, so what does it say when they are eating out less today than they did a year ago? The last time this happened was the third quarter of 2007, as depicted in the chart below. Again, Wall Street calls this noise in the underlying data.
(click to enlarge)

Eating at home is clearly not the only sacrifice that consumers are making today. In examining the details of the most recent retail sales report, depicted below, you can see a significant decline in spending on electronics, appliances, and general merchandise, and a second monthly decline in vehicle sales out of the last three.
(click to enlarge)

.
In addition to the economy being in a weaker state today than in prior years, the stock market faces a headwind it has not had to contend with since the recovery began. We are no longer seeing growth in earnings or revenue.
According to the data provided by S&P Dow Jones Indices in the chart below, S&P 500 operating earnings have now declined sequentially for two consecutive quarters on a year-over-year basis. Even the more forgiving estimates calculated by earnings aggregators like S&P IQ and Thompson Reuters, which exclude pension and option expenses from operating earnings, are showing that the current quarter will be the first year-over-year decline since the last recession. The last time we saw such a sequential decline was in the third quarter of 2007.
.
| OPERATING | ||
| QUARTER | EARNINGS | |
| END | PRICE | PER SHR |
| ACTUAL | ||
| 12/31/2012 | 1426.19 | $23.15 |
| 09/30/2012 | 1440.67 | $24.00 |
| 06/30/2012 | 1362.16 | $25.43 |
| 03/31/2012 | 1408.47 | $24.24 |
| 12/31/2011 | 1257.60 | $23.73 |
| 09/30/2011 | 1131.42 | $25.29 |
I've never witnessed so many high profile companies miss earnings and/or revenue estimates and guide lower, only to see the broad market indices grind higher. It used to be that when bellwethers like Oracle (ORCL), Caterpillar (CAT), McDonalds (MCD), General Electric (GE) and IBM disappointed investors, the broad market would follow. Then again, this is a new era where investors trade stocks, while computers trade the indices and the futures on those indices.
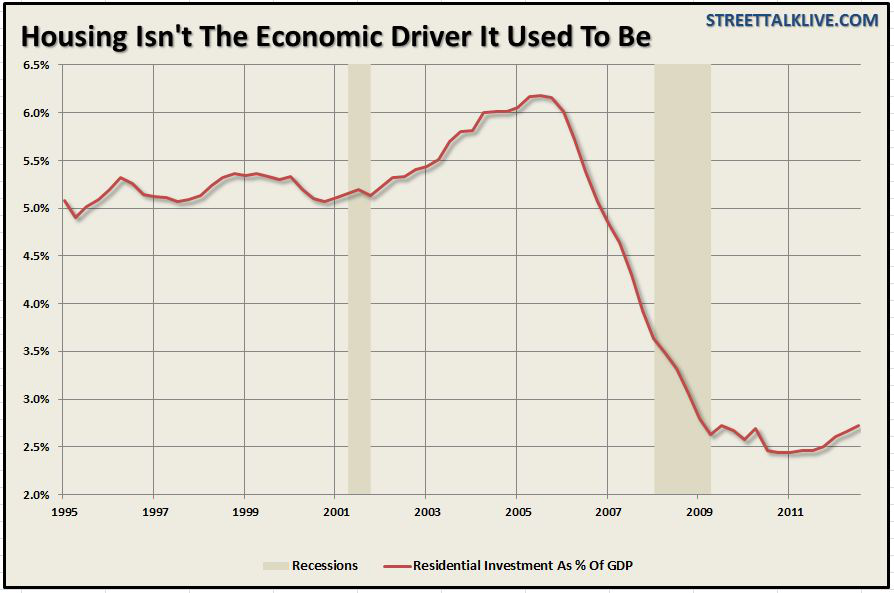
The most prevalent counter-argument to another economic lull is that the housing market recovery will be powerful enough to sustain current rates of economic growth. I'm not convinced. Housing is recovering. There has been an increase in new home construction and a modest recovery in home prices nationwide from the bottom that was established 18 months ago. Still, with the housing industry accounting for just 2.6% of overall economic growth, even when one accounts for the ancillary growth that results when a new home is built, the base is too small to offset the significant headwinds from declines in consumer and government spending.
(click to enlarge)
Furthermore, recent reports raise questions about the sustainability of the strength we have seen in housing over the past year. Sales of new homes declined 4.6% in February to an annual rate of 411k, which was the biggest monthly drop in two years. The modest increase in March to an annual rate of 417k was still below the January rate of 431k. Perhaps this is why the National Association of Homebuilders confidence index declined in April for a third month in a row to just 42 from a reading of 44 in the prior month, well below expectations for an increase to 45.
I believe that the economy is in a weaker state today than at any point in the prior three years, and I am certain that market fundamentals have peaked and are beginning to deteriorate. But what should concern investors the most, should the economy stall and stock prices correct, is that there will be no new QE program to assuage investor sentiment. We will no longer have the excuse that the current program's termination is the reason for the economic malaise. The anxiety in the market that accompanied the maturing of each program will be replaced with an anxiety that there is no new QE program to resuscitate the patient, because the previous one never ended. This is the most significant factor in making what is likely to be a summer slowdown accompanied by a market correction different than the past three years, and in a very disconcerting way.
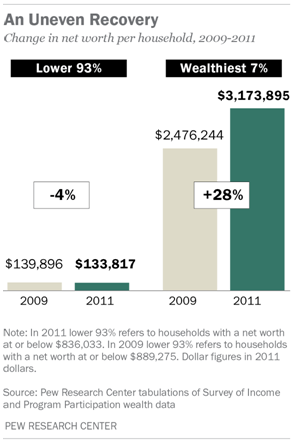
My expectation and hope is that the public will start to question the efficacy of QE in stimulating economic growth and creating jobs, leading to its end. In my opinion, the Pew Research Center's analysis of recently released Census Bureau data best exemplifies how QE works. During the first two years of recovery, through 2011, the wealthiest 7% of American households saw their net worth increase 28%, while the lower 93% saw their net worth decline by 4%.
The majority of Americans do not have enough wealth in financial assets to benefit from Chairman Bernanke's stock market experiment. Instead, they have most of their wealth tied up in the value of their homes. The problem is that you can no longer spend your home! If we don't figure out a way to bring the 93% along for the ride that the 7% have been enjoying the past four years, the US economy is in deep trouble.
.
I agree with what seems to be a growing consensus that we will see a stock market correction in the near term. The initial correction, should it occur, is likely to be rather abrupt, because movements in the broad indices are no longer determined by human factors, but instead are dictated by the computer algorithms that provide the market with its only source of liquidity, a liquidity that can evaporate in response to nothing more than a tweet. I can't imagine how this matrix of machines will respond to a significant adverse event or an inundation of headlines that are overwhelmingly negative.
Where I don't agree with the consensus is that a mere 5% decline realigns market prices with the economic fundamentals and presents a buying opportunity in the indices. I don't believe the consensus appreciates how poor the fundamentals are today, which is not surprising, considering that the consensus is primarily made up of the wealthiest 7%. There is also the significant risk that the correlation between QE and financial asset inflation breaks down. In the heat of a decline of 5% or more, will investors still see an investment opportunity when they realize there is no new monetary catalyst to end the decline and resume the uptrend? In other words, how will the market respond when it sobers from its drug-induced state, following a market correction, only to realize that it never experienced the withdrawal associated with the end of its last prescription?
What I am focused on, as we enjoy the short-term fruits of the Fed's largesse and begin another deceleration in economic growth, is how to position for the coming acknowledgement that QE fails to foster the economic growth and job creation that the Fed continues to avow it does. That acknowledgement will undoubtedly bring with it new investment opportunities.
0 comments:
Publicar un comentario