Here's What Happened The Last Time The Fed Owned All Outstanding Treasuries
Apr 4 2013, 15:27
by: Matthew Claassen
The Fed's massive bond buying program at that time didn't alter the fundamental macro-economic backdrop so much as it did stock and bond prices. In fact, as a result of the Fed's interest rate policy the Dow Jones Industrial Average continued to advance despite a sharp eight-month recession. The 1945 recession was one of the only periods in our history where equity indices ignored the economy, advancing more than 20% right through the recession. We are already seeing equities continue to new all-time highs despite recession like statistics in various economic indicators around the globe. Can equities ignore a recession again?
That doesn't appear likely, and the answer may be found in how the market cycles reacted to Fed policy in the 1940s. We write more on that below. In addition to equities ignoring the 1945 recession, long-term Treasury yields remained below 2 ½% in the face of wild swings in the economy in the late 1940s; from 25% inflation to 3% deflation.
Noted economist Milton Friedman's economic analysis of that time period pointed out that the prevailing investor attitude of the 1940s was that equities were so artificially supported it would all end badly, an attitude he attributed to preventing the emergence of a new secular bull market.
If this isn't the first time the Federal Reserve embarked on a monetary program resulting in owning nearly all available U.S. Treasuries, what can history teach us of the possible consequences of open ended quantitative easing and its unwinding? In the late 1940s it appears the Federal Reserve simply got lucky. Anti-inflation legislation signed by President Truman in 1948 (similar in effect to current calls for austerity) led to a recession and a brief resurgence of deflation. Recession meant a higher demand for Treasuries and provided the Fed with the opportunity to unload most of their short-term bond holdings. Of course, by selling their position they deepened the recession and may have been the instigator of the reemergence of deflation. But, if they didn't unwind their Treasuries into the recession, they would have been forced to unwind into a period of time where investors preferred stocks over bonds. History blames the Fed's 1940s unwinding for making the recession of the time even worse, where the alternative would have been stunting economic growth sparked by the 1950s Korean War. The point is that without a meaningful economic downturn, the Feds unwinding of their massive Treasury holdings, when they decide the economy is healthy again, will likely stunt economic growth for many years to come. Considering the global effort of central bankers to mimic the Federal Reserve's quantitative easing, any attempt to unwind Treasury holdings would need to be coordinated globally to minimize the negative impact. What are the chances of that?
What History Can Show Us
To fully understand the possible consequences of today's monetary policies we must start with understanding the differences and similarities between the 1940s and today. A good place to start is with one of the most obvious similarities; the impact of Federal Reserve policy on the four-year equity market cycle.
According to comments directly from Federal Reserve Chairman Alan Greenspan in the 1990s, the Federal Reserve cannot eliminate a business cycle or coincident equity market cycle, but they can alter its length and intensity. This is often why something as simple as a four-year equity market cycle has shown such a significant variance over the decades. Cycle troughs (corrective lows) have appeared anywhere from 40 months to as much as 73 months apart. But when we ask the question referring to what degree the Federal Reserve can alter this cycle, we find the answer in history and the one occasion where it can be reasonably determined that the Federal Reserve inverted the four-year cycle in stock market prices.
The four-year cycle has been evident in stock market prices since 1871, and was first discovered in 1912 by a group of New York investors.[1] It was known at that time that the Rothschild's had analyzed British government obligations and divided the price obligations into a series of repeated curves. The group of New York investors hired a mathematician to discover the Rothschild's secret formula. While working with the Dow Jones Railroad Average, the mathematician discovered the forty-one month cycle. It's theorized that this cycle coincides with the Kitchen cycle, named for Professor Joseph Kitchen who, in the very early 1920's, was able to show a 41-month cycle in bank clearings, wholesale prices and interest rates. In fact, original writings on the four-year equity cycle indicate an identical average period of 41-months from trough to trough which remained consistent up until 1946. [Linear cycles are always measured from trough to trough and defined by the average period.]
Oddly enough, and with no obvious reason (at that time), the stock market made a cyclical bull high in 1946, precisely when the four-year cycle was due to trough. For those who understood and monitored cycles during that time period, this was an unexpected surprise. Edward Dewey, the founder of the Foundation for the Study of Cycles would later write; "Then, in 1946, something strange happened to our cycle. Almost as if some giant hand had reached down and pushed it, the cycle stumbled, and by the time it had regained its equilibrium it was marching completely out of step from the ideal cadence it had maintained for so many years. It has regained the approximate beat of forty-one months or so, as before, but its behavior now appears upside down on our graph. Scores of explanations and reams of paper have been expended to explain this behavior. We are familiar with most of the possibilities, such as distortion by random behavior, two or more other cycles of near lengths, and even a general public knowledge of this particular cycle, which may have had a distorting effect on its timing. But, in truth, no one can positively explain what happened in 1946…" [2]
(Click to enlarge)
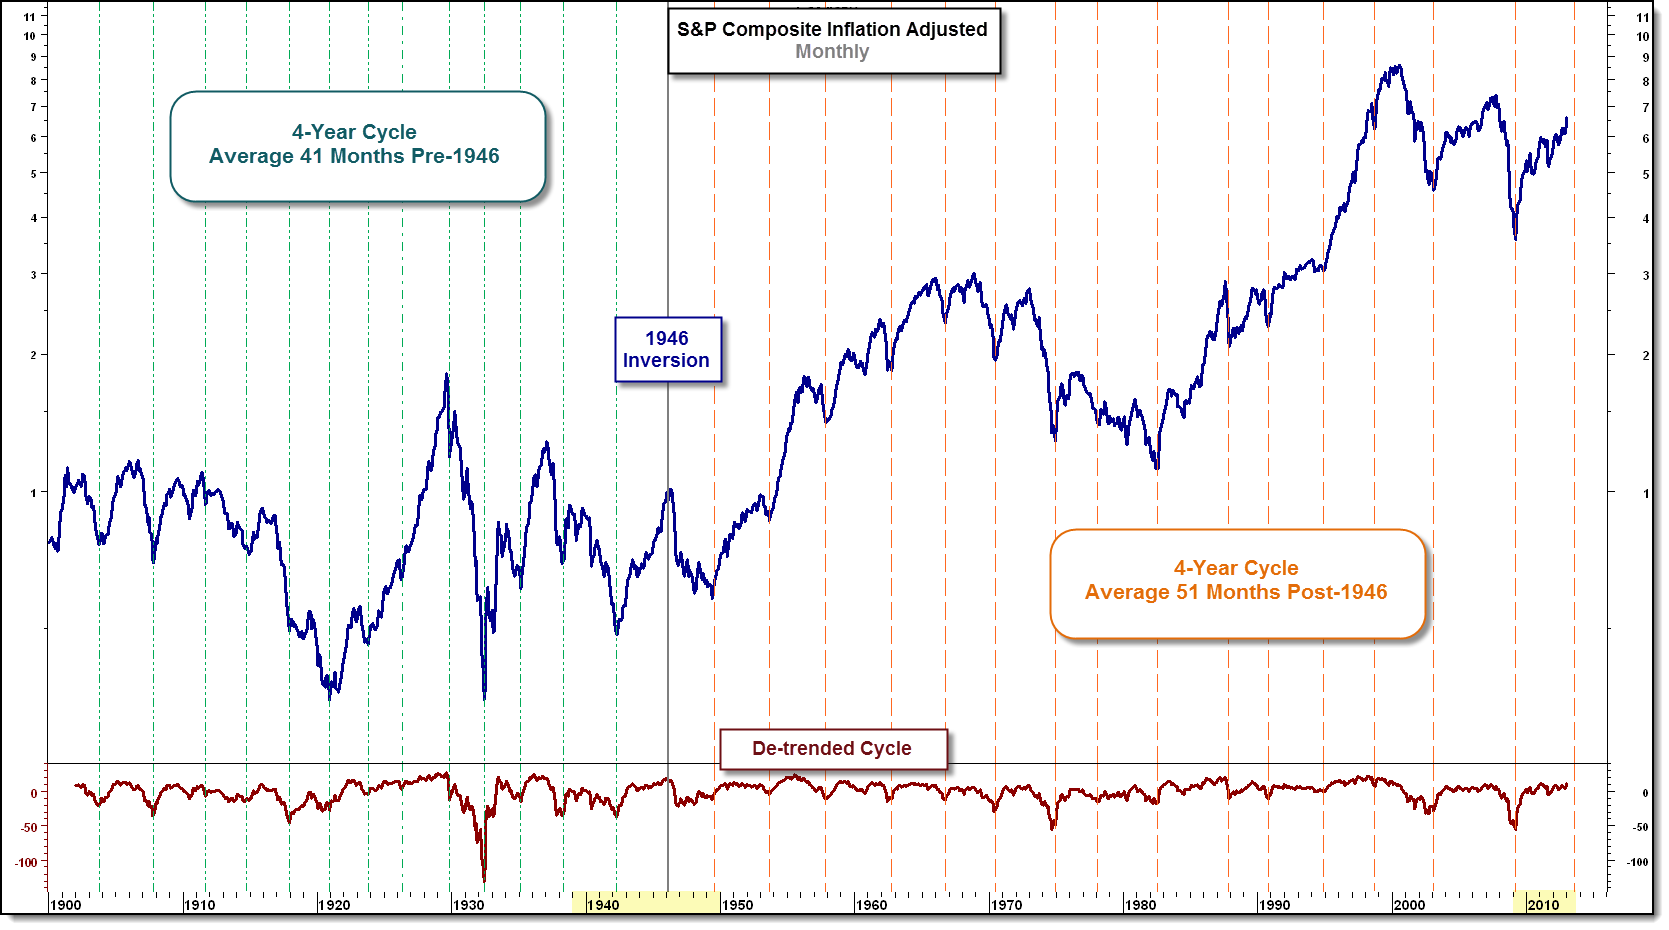
S&P Inflation Adjusted Composite 1900 to 2013
The chart above denotes the four-year cycle lows since 1900 with dashed lines. To better visualize the cycle inversion; prior to the 1946 high, the four-year cycle lows are coded with green lines. After the inversion, the cycle lows are marked with orange lines. The answer as to why or how this cycle inversion came about may be surprisingly simple and, more importantly, can have a direct impact on the current long-term outlook for equities.
(Click to enlarge)
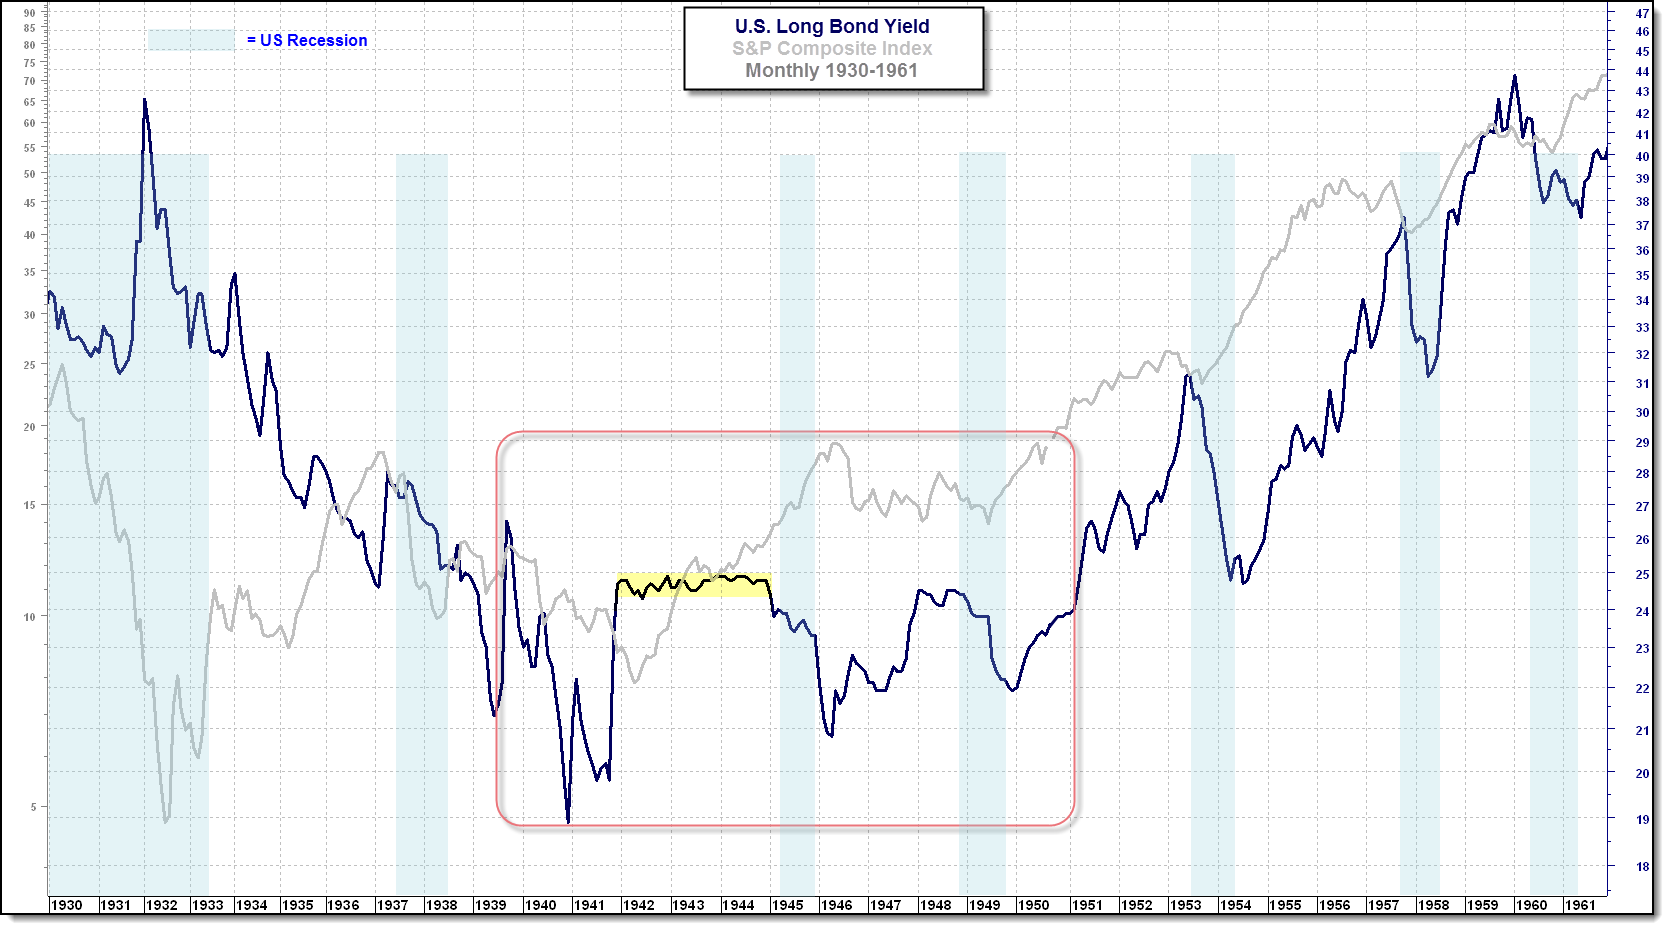
U.S. Long Bond Yield, S&P Composite Monthly (not adjusted for inflation)
A close study of the above chart of long-bond yields shows the period of 1940 to 1950 as unusual in that yields were held in a trading range; neither trending lower nor higher. Even more, the stability of yields from 1942 through 1944 appears uncanny. One would think it was a period of unusual economic stability. But nothing could be further from the truth. Actually, the 1940s was a period of extreme economic volatility and artificial stability in the bond market. Although interest rates remained low, as can be observed in the chart above, there were swings from 25% inflation in 1946-47 to 3% deflation in the July 1948 - July 1949 period, followed by 10% inflation from March 1950-March 1951. So why the stable yields?
From 1939 through the 1940s, out of concern for stabilizing the government securities market and financing World War II, the Federal Reserve agreed to peg interest rates. Twelve-month certificates of indebtedness were kept at a range between 0.875% and 1.25% and short-term Treasury yields were pegged at 0.375% as Federal Reserve Banks were instructed to purchase all 90-day T-Bills offered at .375%. While there were no formal instructions regarding long-term yields, it was understood that they would not be allowed to rise above 2 ½%.
With the Federal Reserve committed to interest rate stabilization, wage and price controls were authorized by Congress, as well as regulating hiring and firing of workers and the rationing of scarce commodities. These policies were sold as necessary to win the wars in Europe and in the Pacific, as history then and since suggests was probably true.
[3]The 1940s was an incredibly interesting time with regards to macroeconomics, unprecedented government intervention and the maturing of the Federal Reserve. During this decade the Federal Reserve gave up independence and evolved from goals of stabilizing interest rates to that of providing price and income stability. (The current Fed Mandate originated in 1977.)
However, what is relevant to our current environment is how markets reacted once the Federal Reserve regained its independence and removed itself from artificially supporting bond prices. That occurred with the 1951 Treasury and Federal Reserve Accord; an agreement reached after the Federal Reserve took unprecedented action to reinstate its independence. [1]
First, it should be noted that there is a difference in the S&P Composites illustrated in the two charts above. In the first chart above we have applied an inflation adjusted S&P Composite Index. The adjustment for inflation makes identifying long-term equity cycles much easier. The second chart above is not adjusted for inflation. Recall that the economic period immediately following 1946 included double-digit inflation as high as 25%.
While the nominal price of the S&P Composite went sideways in a tight trading range, after adjusting for inflation, real prices were in a sharp cyclical bear trend. When Dewey wrote his comments quoted above, it was long before computers, and investors did not typically adjust equity indices for inflation. Thus his quote "…the cycle stumbled, and by the time it had regained its equilibrium it was marching completely out of step from the ideal cadence it had maintained for so many years." It's likely his comment about the cycle stumbling was in reference to the trendless period from late 1946 to mid-1949. In fact, prices corrected significantly on a real basis until inflation subsided and the Federal Reserve exited their program to artificially subdue bond yields.
More relevant to our current market potential is the period prior to 1946. Note how from early 1942 through 1944 Treasury yields remained pegged at the peak rate the Fed would allow. Had interest rates and Treasury yields been allowed to rise, it would seem logical that the rally into 1946 would have been cut short and behaved more in-line with the preceding forty-one month cycle.
Certainly, the war effort could have been good for the long-term trend in equities, markets typically decline as rumors of war build and rise "at the sound of cannons." But, the above chart of artificially subdued Treasury Yields speaks strongly to the probability that Federal Reserve intervention altered the four-year equity market cycle in the 1940s. In fact, according to NBER.org, there was an eight-month U.S. recession from February, 1945 through October, 1945 during which time the Dow Jones Industrial Average (DJIA) gained approximately 23% as the Fed continued to purchase Treasuries and expand its balance sheet!
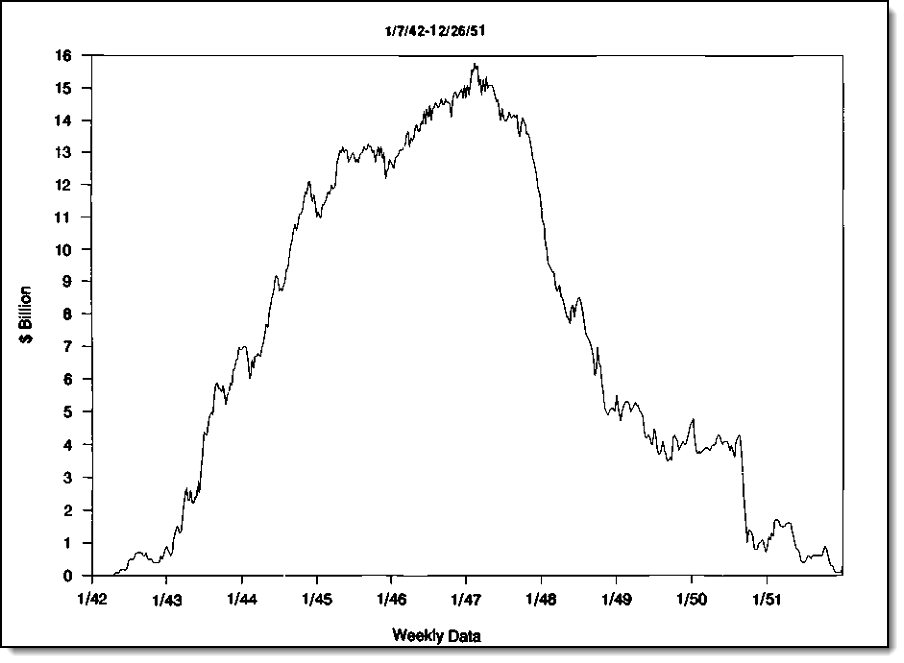
To be sure, one could mistake the rapid advance in the two charts below, illustrating Federal Reserve holdings from 1942-1951, as referencing recent statistics regarding the current expanding Federal Reserve balance sheet. They in fact represent the 1942 to 1946 expansion of holdings in U.S. T-bills (first chart) and total holdings of long and short-term securities (second chart). Here, again, we can visualize the rapidly expanding and extreme involvement the Federal Reserve had in the bond market. *By the end of World War II, the Federal Reserve System held virtually the entire supply of Treasury bills.
Prior to these purchases it held negligible amounts of bonds. Liquidity provided by bond and T-bill purchases, coupled with the demise of government price controls in July of 1946 is blamed for the rapid advance in wholesale inflation of 25%. Absent preceding price controls, wholesale inflation would have probably started in the early 1940s and advanced at a more controlled measure.
(Click to enlarge)
Federal Reserve T-Bill Holdings 1942-1951*

(Click to enlarge)
Federal Reserve Total Security Holdings 1942-1951*
*source: NBER - Before the Accord: US Monetary -Financial Policy, 1945-51. Eichengreen and Garber, 1991
When we consider the current equity market response to a similar, albeit more aggressive and global monetary policy, it's not a stretch to conclude that the Federal Reserve monetary policy was a primary factor in the disruption and inversion of the four-year equity market cycle in the 1940s. The question investors now face, with a current cyclical bull trend that recently turned four-years old is; is the four-year cycle inverting once again? We won't know the answer to that question except in hindsight. However, being aware of history can help us understand and generate realistic expectations going forward.
Unfortunately, linear cycles have a large variation. As previously noted, the four-year cycle has varied from between 40 and 73 months trough to trough, averaging 51 months since 1946. March marked the 48th month of the current bull cycle and the Federal Reserve is still averaging $1 Trillion per year in security purchases. If the four-year cycle has inverted, as it did in 1946 and the resulting bear trend cannot be delayed indefinitely, then an important cyclical top should occur sometime soon as new all-time highs are not likely to be sustainable.
Conversely, if a consequence of the Federal Reserve's bond purchases is an indefinite delay of the terminal peak in the long-term market cycle, the four-year cycle could possibly be delayed until such time as the Federal Reserve begins its exit from a monetary policy of intervention. In that case, it would be more likely that the equity market trade in a prolonged sideways pattern similar to the top in the year 2000.
A final and important thought; In a paper written in 1963 and titled A Monetary History of the United States, 1867-1960, authors Milton Friedman and Anna Schwartz attempted to understand the market psychology that drove investor reactions to the Federal Reserves and government policies of the 1940s and very early 1950s. The author's conclusions on that subject, we believe, are pertinent to current market psychology and foretelling of what has to change in the mindset of the average investor in order for a new secular bull trend to emerge.
When making the argument for why investors did not sell bonds and buy stocks during the high inflation period of 1947-48, but did sell bonds to buy stocks in 1950, they wrote:
[4]"That factor was a continued fear of a major contraction and a continued belief that prices were destined to fall. A rise in prices can have diametrically opposite effects on desired money balances depending on its effect on expectations. If it is interpreted as a harbinger of further rises, it raises the anticipated cost of holding money and leads people to desire lower balances relative to income than they otherwise would. In our view, that was the effect of price rises in 1950...On the other hand, if a rise in prices is interpreted as a temporary rise due to be reversed, as a harbinger of a likely subsequent decline, it lowers the anticipated cost of holding money and leads people to desire higher (cash) balances relative to income than they otherwise would. In our view, that was the effect of price rises in 1946 to 1948...
Despite the extent to which the public and government were exercised about inflation, the public acted from 1946 to 1948 as if it expected deflation. There is no real conflict. The major source of concern about inflation at that time was not the evils of inflation per se...but the widespread belief that what goes up must come down and that the higher the price rise now the larger the subsequent price fall. In our view, this fear or expectation of subsequent contraction and price decline reconciled the public to only a mild reduction in its liquid asset holdings relative to its income and induced it to hold larger real money balances than it otherwise would have been willing to. In this way, it made the postwar rise more moderate."
How many times and how many pundits have been heard in past months espousing that the Fed's open-ended monetary policy "will end badly?" This is the very real fear investors are faced with despite all time new highs in the Dow Jones Industrial Average and Nasdaq Composite, and identical to the investor sentiment of the 1940s. As was in 1946 relative to the Stock Market Crash of the early 1930s; investors do not have faith that the equity price trend will continue, and they fear a repeat of the 2007-2009 or 2000-2002 bear trends. That fear is based on the near universal understanding that without the Fed intervention, equity prices would be substantially lower. As Friedman observed of the 1940s; as long as this belief persists, investors will, for the most part, continue to hold large cash reserves and choose Treasury bonds over equities. Most of their money is not leaving the sidelines anytime soon. This same behavior can be applied to the decisions of business leaders. Until investors' prevailing belief that "this will end badly" is replaced by a less cancerous outlook, the creation of a new secular bull trend in equities or bear trend in bonds is unlikely.
Conclusión
At 49 months, this is an old bull market that is struggling to finally post new all-time highs in the S&P 500. While some investors argue that the cycle's longevity is evidence of a new secular uptrend, history shows that the Federal Reserve monetary policy can extend and even invert equity cycles. With all things considered, it's reasonable to conclude that the new highs of the current equity cycle are more the result of Federal Reserve artificial support than any improved economic condition or outlook required to launch a new secular uptrend. If new all-time highs are not part of a new secular uptrend, then they should be relatively short-lived.
What about the unwinding of the Federal Reserve Balance Sheet? What does the experience of the late 1940s and early 1950s suggest we should expect this time around?
While there are many differences between the 1940s and today, perhaps the most relevant similarity is the all-important market psychology. To paraphrase the combined conclusions of Milton Friedman and Anna Schwartz in "A Monetary History" and Eichengreen and Garber in "Before the Accord"; there is no justifiable logical reason that investors held Treasuries at such low interest rates in the 1940s. It was simply the investor perception of risk in equities as they distrusted the Fed induced equity market rally into 1946. Investors feared a resurgence of deflation and a repeat of the equity market contractions as experienced into the market lows of 1932 and 1942.
Anti-inflation legislation signed by President Truman in 1948 (similar in effect to current calls for austerity) led to a recession and a brief resurgence of deflation, providing both the opportunity and demand that allowed the Federal Reserve to unload most of their bond holdings. By selling their Treasuries for cash the Fed exacerbated the recession, but was then in a good position to deal with the new inflation expectations that emerged along with the Korean War in 1950. If they had not sold their Treasuries during the 1948-49 period of deflation, they may have been forced to sell their Treasury holdings during the Korean War in competition with rising equity prices and higher inflation expectations.
Most importantly; It can be argued that it was not until the Federal Reserve got out of the role of pegging rates (buying Treasuries) that the foundation for the next secular bull trend in equities was established. As long as the Fed continues to expand its balance sheet in a manner that makes investors cringe as if a rubber band were stretched to snap in their direction, investors will fear a bad ending more than missing out on potential market gains. In the late 1940s the Federal Reserve got lucky and took advantage of an opportunity created by bad Government policy. Will the Fed be so fortunate this time?
1 Cycles; Selected Writings of Edward R. Dewey; The 41-month Cycle In Industrial Common Stock Prices, November, 1951,;republished 1987, The Foundation for the Study of Cycles.
2 Cycles; Selected Writings of Edward R. Dewey; The 41-month Cycle In Industrial Common Stock Prices, November, 1951; republished 1987, The Foundation for the Study of Cycles
3 NBER; Financial Markets and Financial Crisis, Chapter 5, Before the Accord: U.S. Monetary-financial Policy, 1945-51, Eichengreen and Garber, 1991
4 Friedman, Milton and Anna J. Schwartz, 1963; A Monetary History of the United States, 1867-1960. pp. 583-584, Princeton University Press, Princeton, NJ
1 In February 1951 the Treasury, by direction of the White House, attempted to commit the Federal Reserve to maintaining a 2 ½% maximum long-term Treasury Yield via multiple public announcements that there was an agreement to such between the FOMC, Treasury and President Truman. The Fed had never agreed to such a commitment, and made it known. This was followed by President Truman calling in the entire FOMC board into his office for a policy meeting. The White House then, again, publicly announced that the FOMC agreed to continue to peg the long-term at 2 ½%, attempting again to force control on the Federal Reserve. It was only when a member of the Federal Reserve released the confidential minutes of the Presidential meeting, proving there was no such agreement (and embarrassing the President) that Federal Reserve forcefully reclaimed its independence.
0 comments:
Publicar un comentario